Kelowna Real Estate Market Update: July 2026
Is the Kelowna real estate market going up or down?
Both.
It depends on the type of property you own, its price range and where it is located.
Three Central Okanagan single-family home numbers stood out in July:
Trailing 12-month average sale price: $1,180,962 — up 6.1%
Trailing 12-month median sale price: $950,000 — down 2.5%
Trailing 12-month median price per square foot: $397.40 — almost unchanged
All three numbers are correct.
But none of them, on their own, tell you what your Kelowna home is worth.
Why Kelowna’s Average Home Price Increased
There were 21 Central Okanagan single-family home sales over $2 million in July 2026.
There were only eight in July 2025.
That increase in luxury home sales pulled the average price higher.
It does not mean every Kelowna home increased in value.
Homes that sold for under $1 million had a median sale price of $799,375 in July. The same group had a median price of $845,000 last July.
That is a 5.4% decline.
The luxury market became more active. The middle of the market became less expensive. The average price mainly reflected what happened at the top.
This is not just one unusual month.
During the first seven months of 2026, there were 97 single-family sales over $2 million, compared with 73 during the same period last year.
That is an increase of approximately 33%.
Luxury sales have now been running well above last year’s pace for four straight months.
Is the Kelowna Real Estate Market Strong?
I reviewed every July going back to 1999.
July 2026 ranked in the bottom 40% for total single-family sales and was approximately 14% below the 10-year July sales average.
However, the July price per square foot was $406.19.
That was the second-highest July price per square foot recorded since 1999. Only July 2022 was higher.
That creates an unusual market:
Fewer homes are selling, but the homes that do sell are still achieving high prices.
This is not simply a strong market or a weak market.
It is a selective market.
Kelowna Months of Inventory by Price Range
The following single-family months-of-inventory calculations compare current listings with the previous three months of sales.
These are my own calculations rather than official board figures, so they should be used as a guide:
Under $700,000: 4.3 months
$700,000 to $1 million: 4.6 months
$1 million to $1.5 million: 7.4 months
$1.5 million to $2 million: 10.4 months
Over $2 million: 15.4 months
Homes priced between $700,000 and $1 million sold in a median of 36 days.
That remains one of the most competitive price ranges in the Central Okanagan.
What This Means for Kelowna Home Sellers
If your home is worth under $1 million, buyer demand is still relatively strong.
However, that does not mean you can price above the market. Buyers are comparing every option and quickly rejecting homes that appear overpriced.
Homes between $1 million and $1.5 million face more competition. Presentation, condition, location and pricing become more important.
Above $1.5 million, buyers have significantly more choice. Sellers should expect longer selling periods and more negotiation unless the property is clearly better than its competition.
The biggest mistake a Kelowna seller can make right now is using the rising average sale price as proof that their own home increased in value.
What This Means for Kelowna Home Buyers
Buyers searching below $1 million should be prepared to act when the right property appears. Good homes in this range can still sell quickly.
Between $1 million and $1.5 million, buyers have more time and more negotiating power.
Above $1.5 million, buyers may have opportunities to negotiate on price, conditions, closing dates, repairs or included items.
A buyer should not assume that every part of the Kelowna real estate market is declining. The best properties can still attract strong interest.
Kelowna Townhome Market
Townhomes are the property type I would watch most carefully.
The July median sale price was approximately $683,000.
The median price per square foot was $379.53, compared with $407.70 last year. That is a decline of 6.9%.
However, there is an important detail behind that number.
The typical townhome sold in July 2026 was approximately 1,775 square feet. Last July, it was approximately 1,674 square feet.
That is an increase of about 101 square feet per home.
Larger townhomes normally sell for less per square foot than smaller townhomes. This means part of the decline may have been caused by larger units selling, rather than a true 6.9% decline in comparable property values.
The cleanest number is days on market.
Median days on market increased from 40 days to 55 days.
Kelowna townhomes are taking approximately two weeks longer to sell than they did one year ago.
For an accurate townhome value, compare homes with a similar location, age, condition and size. Comparing a 1,300-square-foot townhome with a 1,900-square-foot townhome can create a misleading result.
Kelowna Condo and Apartment Market
The Central Okanagan condo median price during the second quarter was $455,000.
It was also $455,000 during the same period last year.
June appeared stronger, with a median price of $470,500. However, the July median returned to $440,000.
June now appears to have been a one-month change rather than the start of a clear upward trend.
Kelowna condos are not showing a strong recovery or a major decline.
They are holding relatively steady.
The Condo Inventory That MLS® Does Not Show
MLS® data does not include every property competing for a buyer.
Recently completed Kelowna developments such as Water Street by the Park, Aqua and Movala have owners looking to sell or assign their units.
Some of these properties cannot currently be advertised on MLS®.
That inventory is still real. It still competes with resale condos. It simply does not appear in the normal active-listing numbers.
I track new-construction assignments and off-market condo opportunities separately.
Reply to this email and I will send you the current list.
What This Means for Kelowna Developers and Infill Home Builders
The rising average home price should not be used to support a Kelowna infill development pro forma.
The average was heavily influenced by 21 luxury sales.
For infill multifamily projects, builders should focus on:
The likely finished-unit price range
Comparable sales within the same neighbourhood
Unit size and achievable price per square foot
Monthly absorption and competing inventory
Parking, outdoor space and strata fees
Off-market new-construction and assignment inventory
The number of buyers who can afford the finished product
Current demand appears deeper below $1 million, but land, construction, financing and development costs may make it difficult to deliver new units in that range.
Townhome projects also require careful analysis. Larger units may achieve higher total prices but lower prices per square foot, while longer selling periods can increase financing and carrying costs.
A successful Kelowna infill project needs to be designed around the end buyer—not around the citywide average sale price.
Is Kelowna a Buyer’s or Seller’s Market?
There is no single answer.
Homes under $1 million: Relatively tight, but values are softer than last year.
Homes from $1 million to $1.5 million: More balanced, with increased buyer choice.
Homes above $1.5 million: Buyers have meaningful negotiating room.
Townhomes: Taking longer to sell, with softer price-per-square-foot results.
Condos: Generally holding steady, but facing hidden new-construction inventory.
The most important takeaway is this:
Kelowna’s average sale price increased because more expensive homes sold. It did not increase because every home became more valuable.
The headline number came from a small group of high-end sales.
It was probably never about your house.
Get a Kelowna Market Analysis for Your Property
Send me these three details:
Your property type
Your finished living area
Your neighbourhood
I will analyze that specific segment using 27 years of Central Okanagan real estate data.
Your report can include:
Sales activity
Median days on market
Price per square foot
Months of inventory
Comparable property sizes
Year-over-year changes
Recent competing listings
For Kelowna Developers and Builders
Send me:
The property address
Lot size
Current zoning
Proposed housing type
Estimated number and size of units
I can help you review the resale market, likely buyer profile, competing projects, achievable price ranges and possible weaknesses in the proposed development plan.
July 2026 Central Okanagan Real Estate Statistics
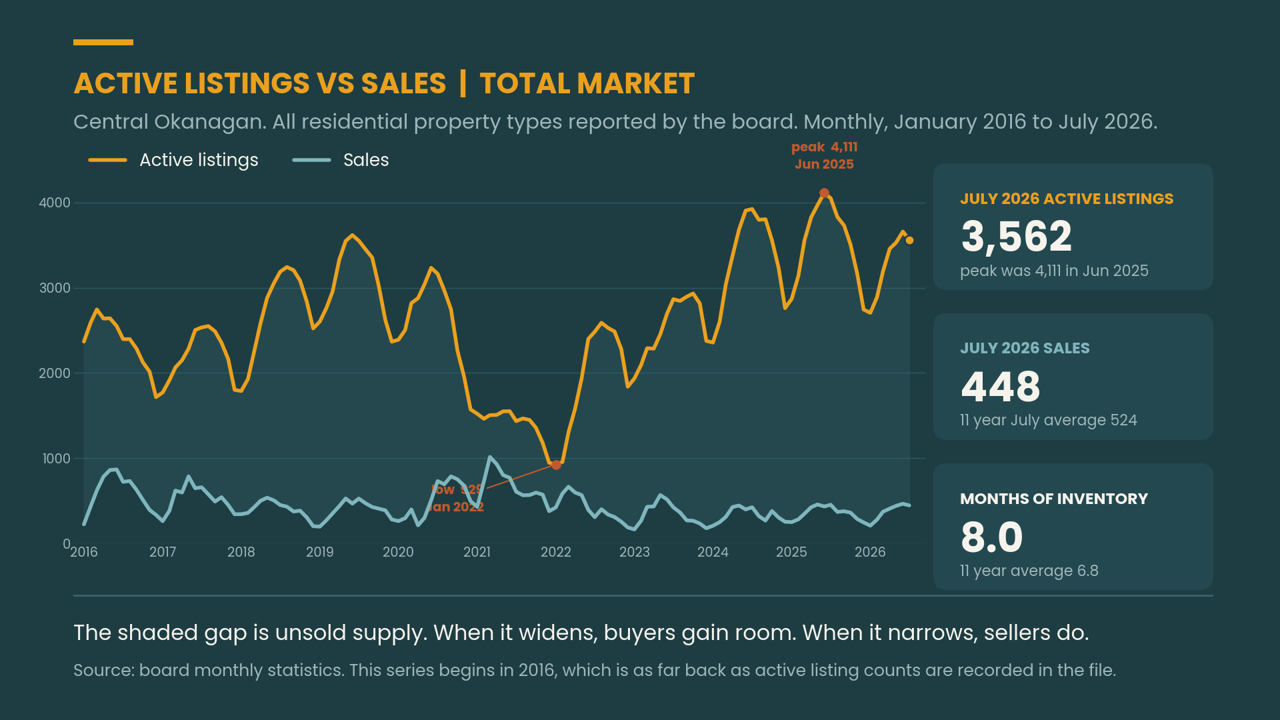
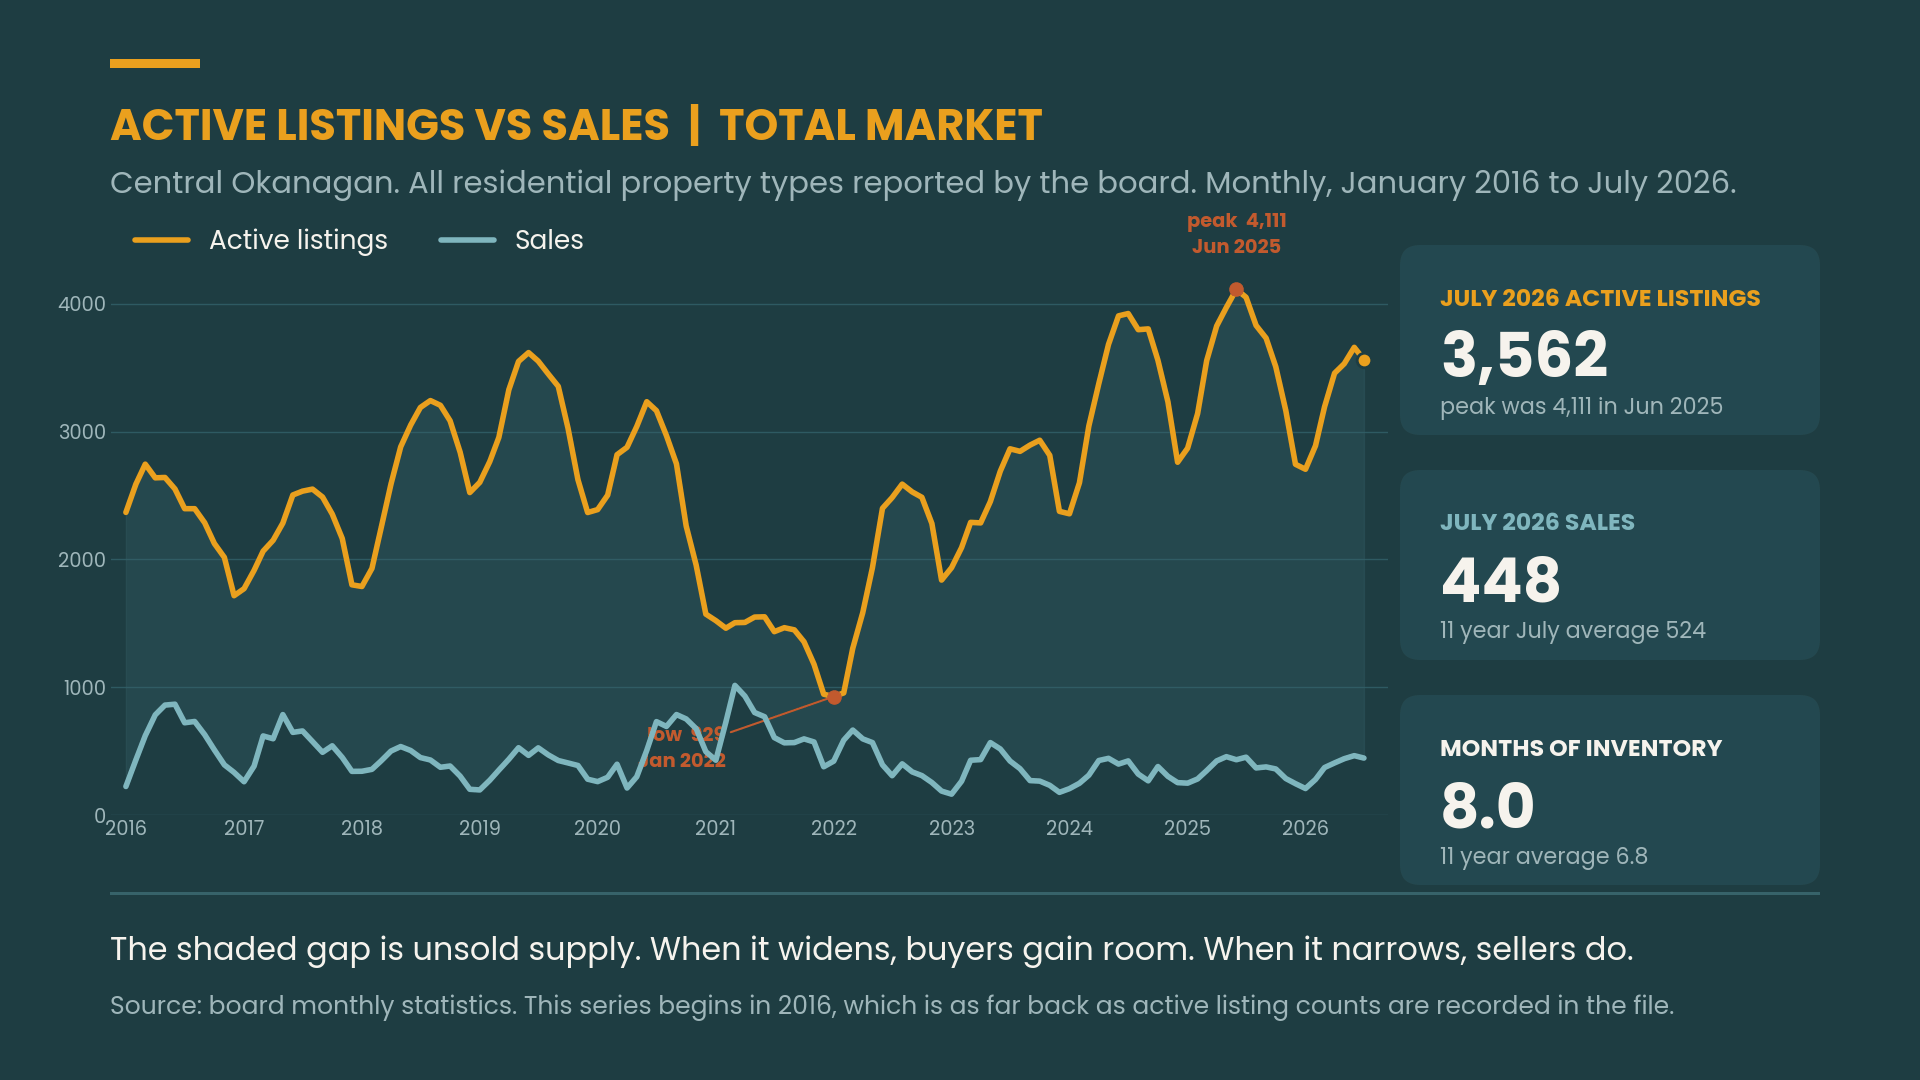
Total Residential Market
July 2026 compared with July 2025
Sales: 448 — down
New listings: 964 — down
Current inventory: 3,562 — down
Months of inventory: 8 — down
Average days to sell: 66 — unchanged
Median days to sell: 48 — unchanged
Median sale price: $765,000 — up
Average sale price: $910,138 — up
Total sales volume: $406.8 million — up
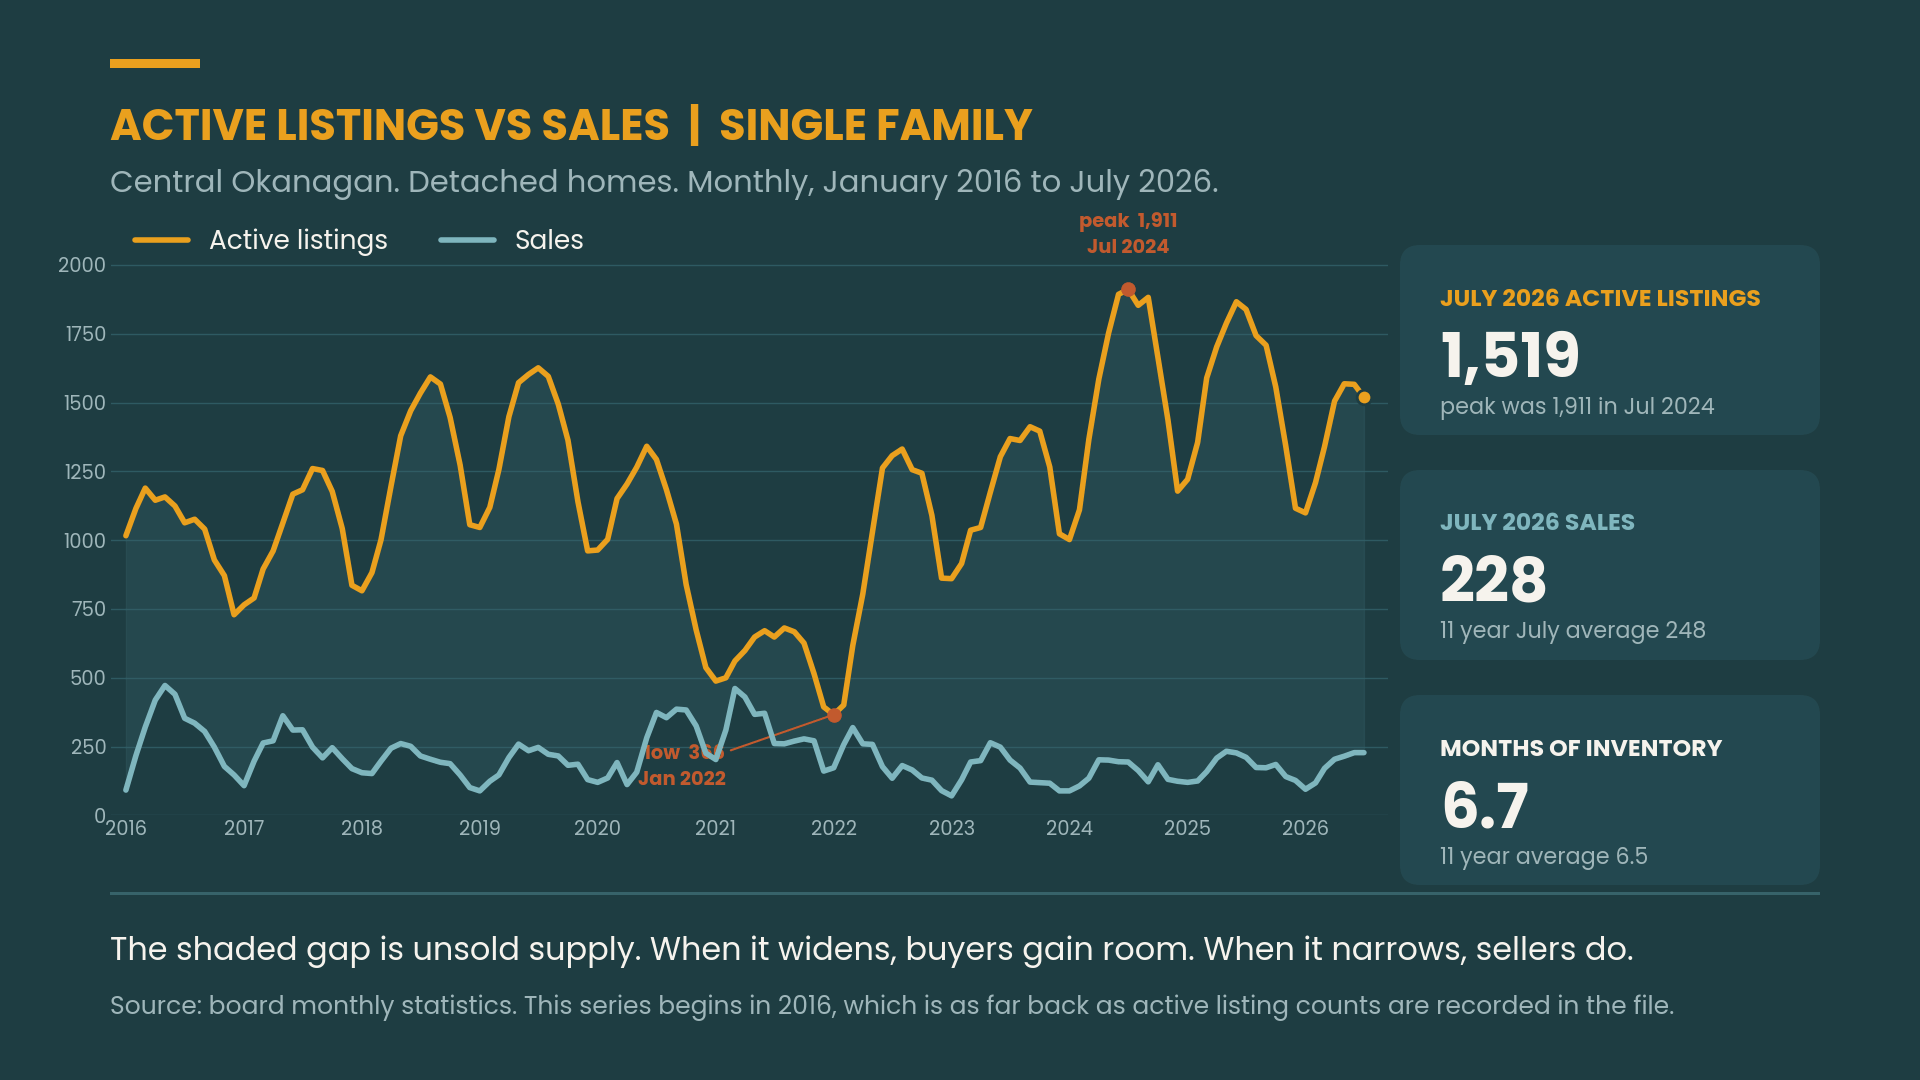
Single-Family Homes
July 2026 compared with July 2025
Sales: 228 — up
New listings: 426 — down
Current inventory: 1,519 — down
Months of inventory: 7 — down
Average days to sell: 57 — up
Median days to sell: 42 — down
Median sale price: $996,750 — up
Average sale price: $1,245,171 — up
Total sales volume: $283.9 million — up
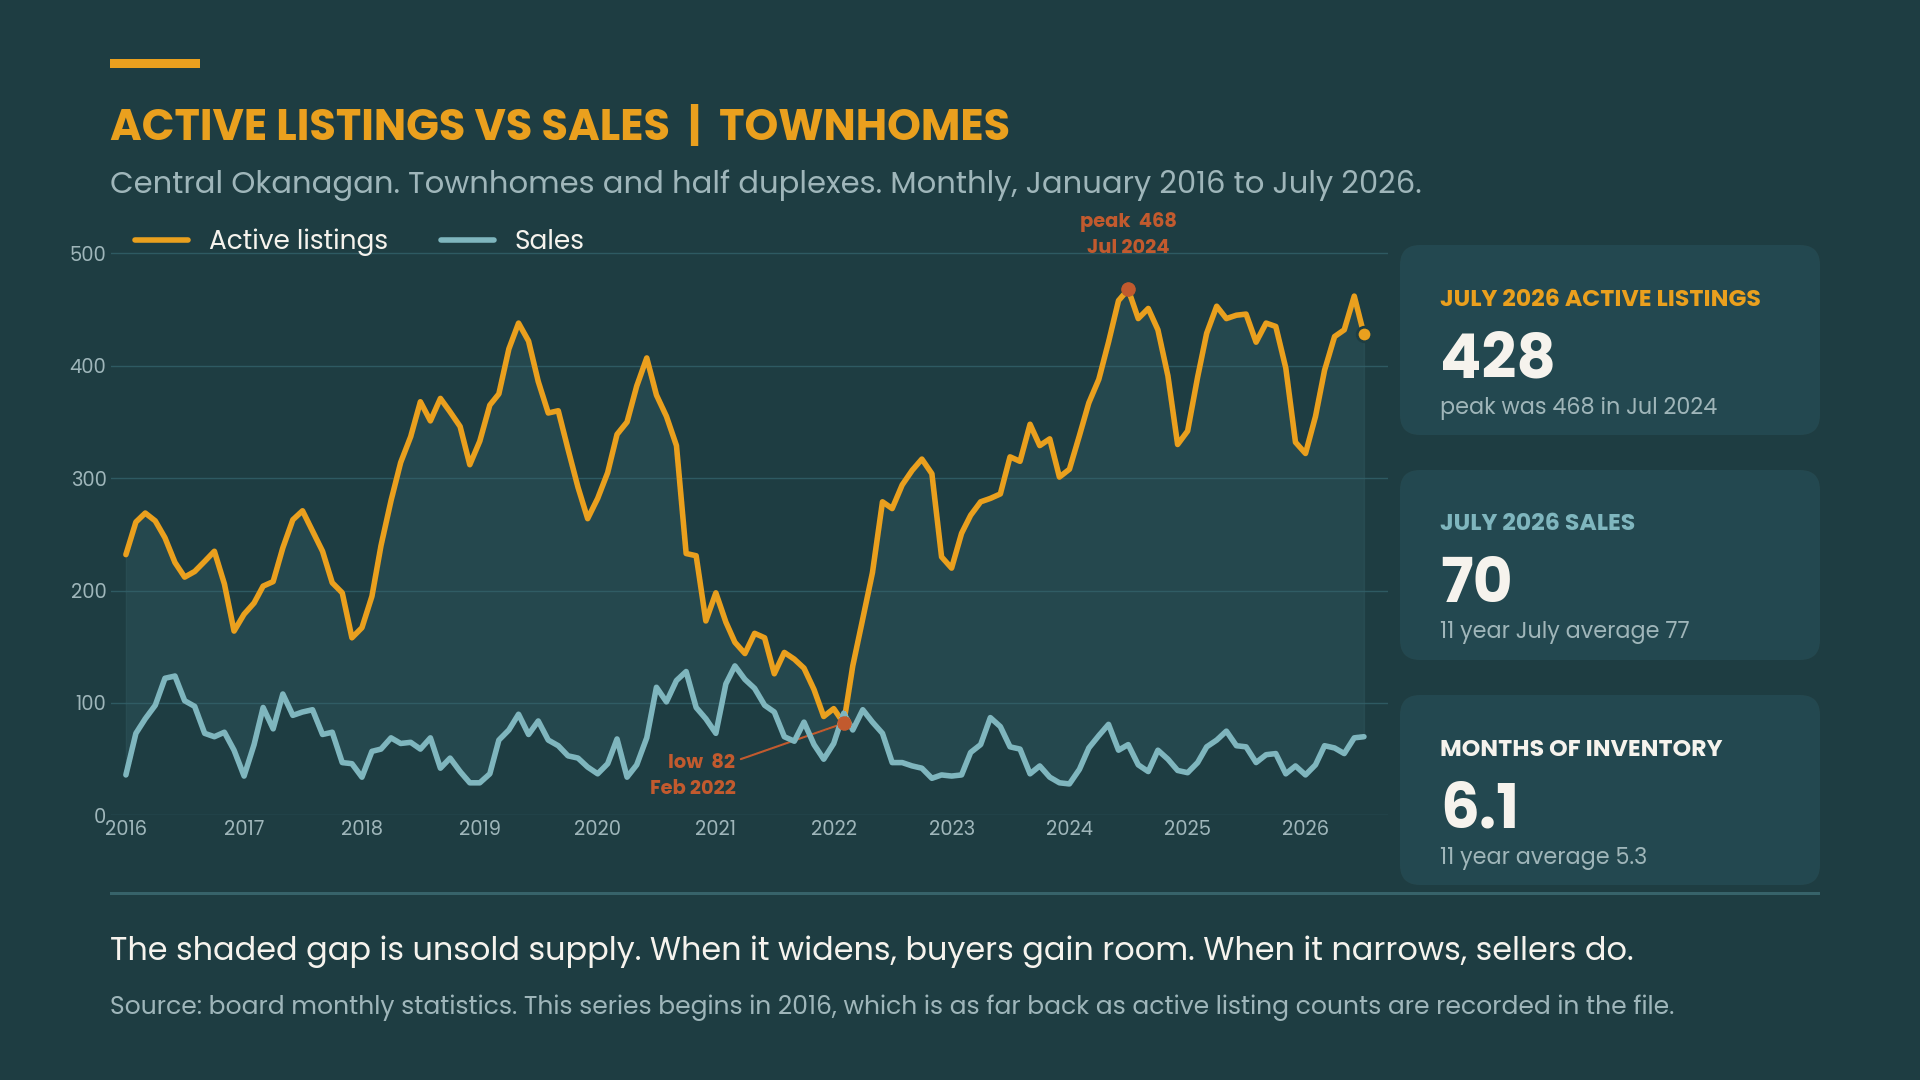
Townhomes
July 2026 compared with July 2025
Sales: 70 — up
New listings: 119 — down
Current inventory: 428 — down
Months of inventory: 6 — down
Average days to sell: 66 — up
Median days to sell: 53 — up
Median sale price: $682,500
Average sale price: $737,851 — up
Total sales volume: $51.6 million — up
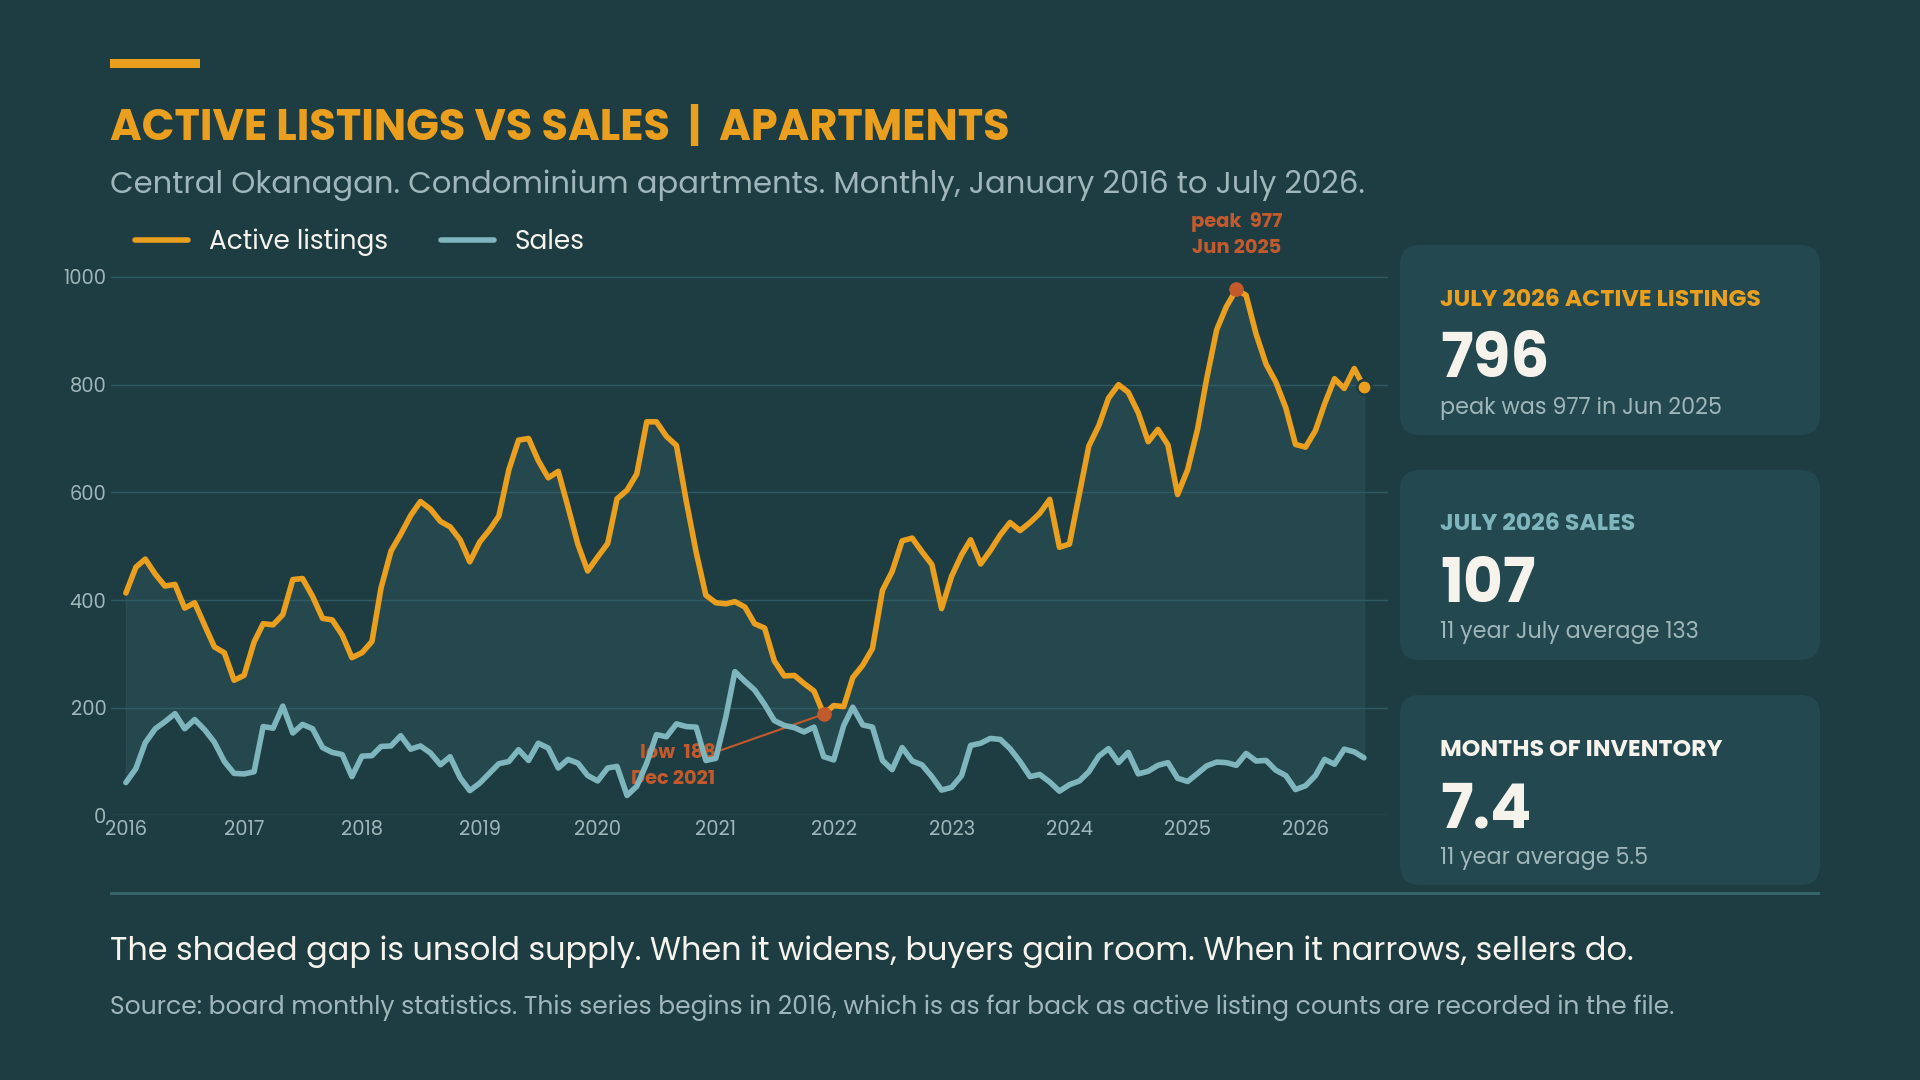
Condos and Apartments
July 2026 compared with July 2025
Sales: 107 — down
New listings: 249 — down
Current inventory: 796 — down
Months of inventory: 7 — down
Average days to sell: 72 — up
Median days to sell: 51 — down
Median sale price: $440,000 — up
Average sale price: $477,988 — down
Total sales volume: $51.1 million — down