Why Falling Kelowna Inventory Doesn’t Always Mean the Market Is Getting Stronger
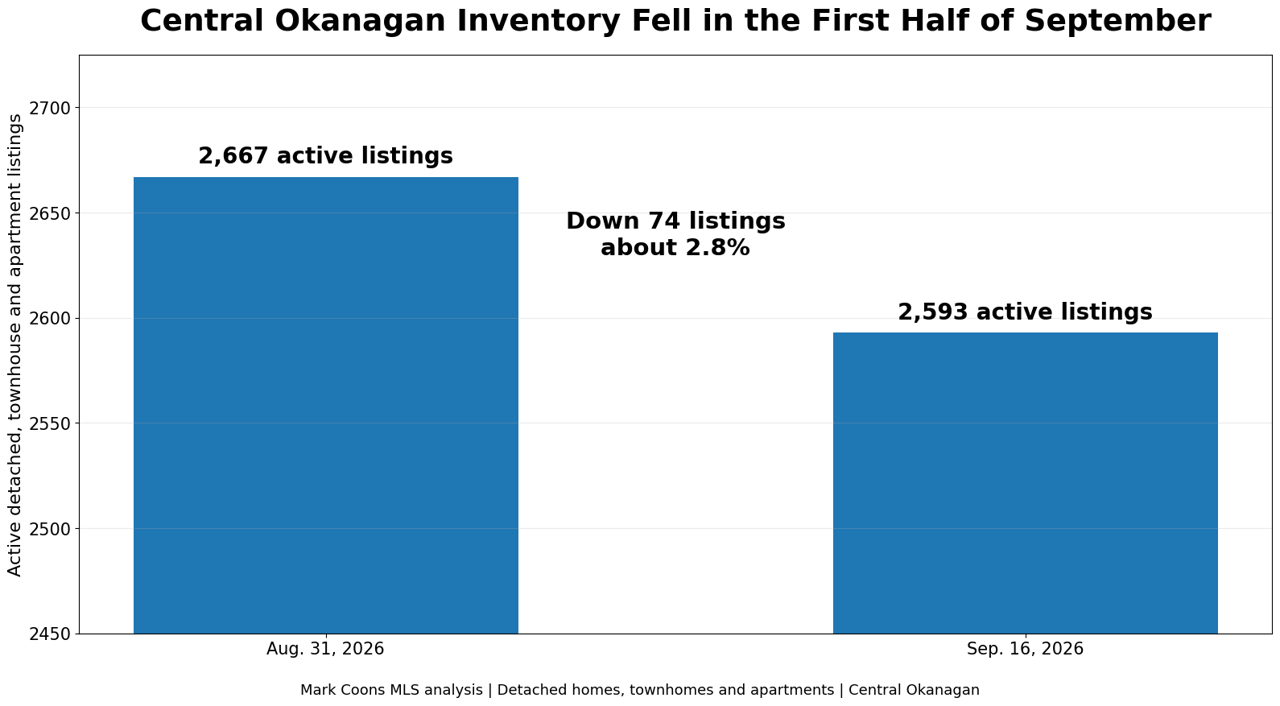
Central Okanagan inventory fell by about 3% during the first half of September 2026. That sounds like the market is tightening. Maybe. But inventory can fall because buyers are buying homes, because sellers are taking homes off the market, or because both are happening at the same time. Those are very different markets.
At the end of August, I counted roughly 2,667 active detached homes, townhomes and apartments across the Central Okanagan.
By September 16, that number was closer to 2,593.
Seventy-four fewer listings.
About a 2.8% decline in half a month.
If that is the only number you look at, the conclusion seems straightforward.
Supply is falling.
The market must be getting stronger.
I don't think the data supports jumping there yet.
Falling inventory only tells us the ending number
Inventory is a snapshot.
It tells us how many properties are available at one point in time.
It does not tell us how they disappeared.
A listing can leave active inventory because:
it sold,
the owner cancelled it,
the listing expired,
or the seller decided to stop trying for now.
Those outcomes all reduce the active listing count.
Only one requires a buyer to purchase the property.
That distinction matters.
Buyers were still active
This is not a story about demand disappearing.
From September 1 through September 15, I counted 129 detached, townhouse and apartment sales.
During the first half of August, there were 136.
That is only about a 5% decline.
So buyers were still making decisions.
The homes that sold during the first half of September had a median current market time of about 51 days.
In August it was around 55 days.
That was one of the more interesting findings from this week's research.
The homes that are selling are not suddenly taking longer to sell.
The homes that are not selling are getting older.
The active inventory tells a very different story
Across roughly 2,600 active listings, the median property had accumulated about 105 days of market exposure.
Nearly seven out of ten had already been exposed for at least 60 days.
More than half had been exposed for 90 days or longer.
Compare that with the homes actually selling at roughly 51 days.
That is a big separation.
It suggests the falling inventory number needs more context.
Some properties are being absorbed.
Others have been sitting long enough that their owners are starting to make different decisions.
Sellers are making decisions too
During one September week, I counted:
Seller action | Count |
|---|---|
Price reductions | 164 |
Cancelled listings | 82 |
Expired listings | 30 |
Those numbers should not simply be added together and called homes leaving the market.
A cancelled property can come back immediately.
An expired property can be relisted.
And a price reduction remains active inventory.
But taken together, they show something important.
There is a lot of movement happening on the seller side of the market.
Sellers are not all standing still while buyers absorb inventory.
Some are changing price.
Some are resetting the listing.
Some are leaving.
This is why falling inventory can mean two very different things
Imagine Market A.
Inventory falls from 2,700 homes to 2,500 because buyers suddenly purchase 200 properties.
New listings stay steady.
Homes sell quickly.
Price reductions decline.
That would look like a genuinely tightening market.
Now imagine Market B.
Inventory falls from 2,700 to 2,500 because sellers cancel, expire or decide to wait until next year.
Sales barely change.
The remaining inventory is old.
That is not the same signal.
Both markets end with 2,500 listings.
The headline inventory number is identical.
The underlying market is completely different.
September looks like it has pieces of both.
Buyers are still buying.
But sellers are also adjusting and leaving.
The relist numbers make this even more interesting
From September 9 through September 15, 257 active listings came onto the market.
Roughly 95 had already been exposed to buyers before.
That is about 37%.
More than one out of every three listings appearing during that week was not truly fresh supply.
It was an existing property coming back for another attempt.
And among the residential relists I could trace to their previous listing, roughly three out of four returned at a lower price.
The typical reset was about 4.4%.
That matters because a simple new-listing count would treat many of those properties as fresh inventory.
Buyers may not see them that way.
The market has already had a chance to react.
Less inventory does not automatically mean less buyer leverage
This is the part I would be careful with if I were buying.
If total inventory falls over the next few months, it would be easy to assume negotiating power is disappearing with it.
That could happen.
But I would first want to know which listings disappeared.
If well-priced homes are selling rapidly while stale properties are being withdrawn, the remaining active count gets smaller.
But there may still be sellers inside that remaining inventory who have been waiting 90, 120 or 150 days.
Those sellers may be much more interesting to negotiate with than the overall inventory number suggests.
The number of choices can fall while negotiating opportunities remain.
Both can be true.
Sellers should be careful with the opposite conclusion
A homeowner can make the same mistake from the other direction.
Inventory drops.
They assume competition is disappearing.
So they decide to hold the price.
Maybe that works.
But the important question is not just how many listings remain.
It is what buyers are choosing.
If your home has already been exposed for 100 days while similar homes keep selling, falling market-wide inventory does not erase that feedback.
A smaller market does not automatically make an overpriced listing more attractive.
What I would watch next
The next few weeks should tell us which force is stronger.
I would watch whether sales hold up as total inventory falls.
I would also watch cancellations, expiries and relists.
If inventory falls while sales stay relatively firm, homes sell faster and fewer sellers need to reduce, that would be stronger evidence that the market is actually tightening.
If inventory falls mostly because more sellers leave while the remaining listings continue to age, that tells a different story.
The headline number alone cannot answer it.
The bigger takeaway
Central Okanagan inventory dropped from roughly 2,667 listings at the end of August to about 2,593 by September 16.
That is real.
What it means is the harder question.
Inventory does not only fall when buyers become more aggressive.
It also falls when sellers decide they are finished waiting.
Right now, buyers are still buying, older listings are accumulating, prices are being adjusted and some sellers are stepping away.
So when you hear that Kelowna inventory is falling this fall, I would not immediately translate that into:
The market is getting stronger.
I would ask one more question first.
Where did the listings go?
That answer tells you much more.
Methodology
This analysis uses my own Central Okanagan MLS review of detached homes, townhomes and apartments.
Active inventory was approximately 2,667 listings at the end of August 2026 and approximately 2,593 listings on September 16, 2026.
The September sales comparison covers September 1 through September 15 against the same portion of August.
Weekly reductions, cancellations and expiries are point-in-time activity measures and should not be treated as a direct reconciliation of the 74-listing decline. Cancelled and expired properties may also return to market.
Relisted properties were identified by tracing prior market exposure where possible. Listing-history matching is imperfect, so relist figures should be treated as an estimate rather than a complete count.
The purpose of the analysis is not to prove why inventory declined. It is to show why a falling active-listing total alone does not tell us whether demand strengthened, sellers exited, or both occurred.
If you want to see the market numbers instead of relying on one headline, I keep the Okanagan Market Dashboard updated here:
https://okanaganmarket.netlify.app/
Mark Coons Personal Real Estate Corporation
Mark Coons, BBA, CE
REALTOR® | eXp Realty Kelowna
Team Lead, Selling Okanagan Group
Relocated to Kelowna in 2018
778-946-6454
[email protected]