What Happened to Central Okanagan Home Buyers Who Bought at the 2022 Peak?
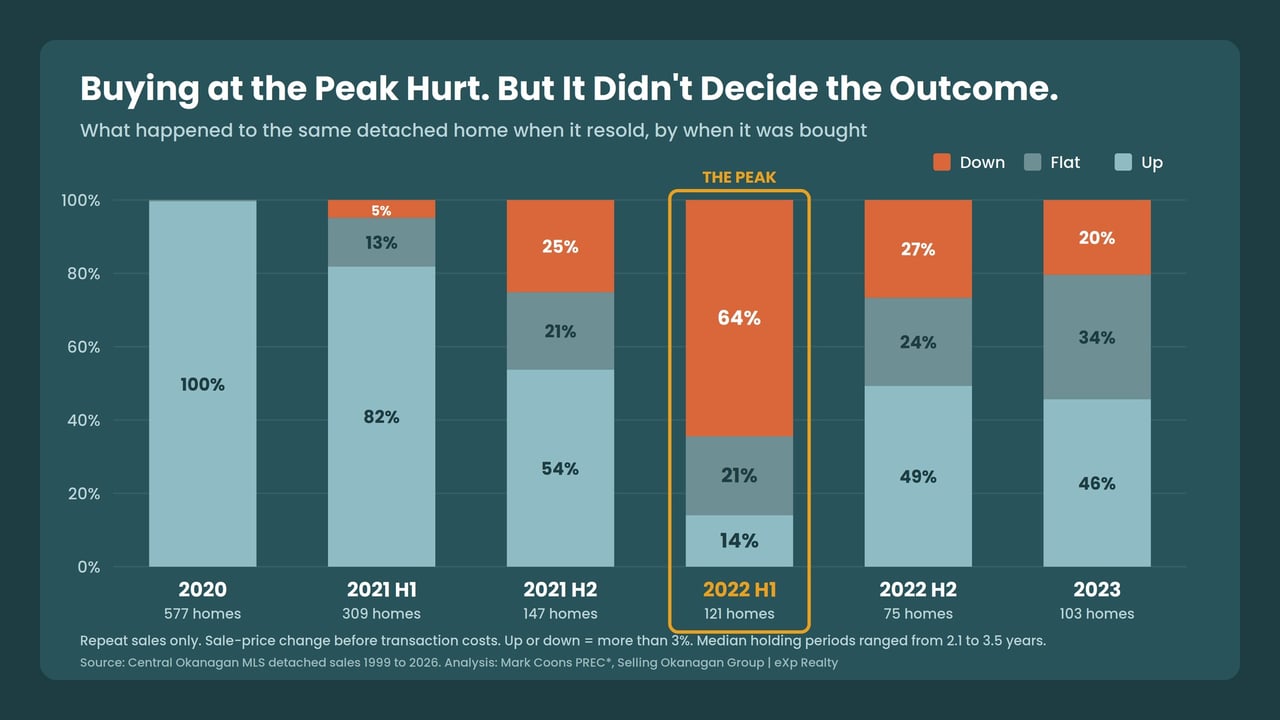
I tracked detached homes bought in the Central Okanagan during the first half of 2022 that later sold again. Among 121 clean same-property comparisons, 64% resold more than 3% below their earlier purchase price, 21% were roughly flat, and 14% sold more than 3% higher. The typical result was about a 7% decline.
That does not mean 64% of everyone who bought in 2022 is underwater.
It tells us what happened to the owners in this repeat-sales sample who actually sold again.
And that difference matters.
There are two things people tend to say about anyone who bought a home in 2022.
“They bought at the top. They must be underwater.”
Or the opposite.
“Real estate always goes up. Just hold it long enough.”
I wanted to know what actually happened.
Not to the average home.
To the same homes.
I tracked the homes bought near the 2022 peak
I pulled every detached home sold in the Central Okanagan from January through June 2022.
There were 1,350 purchases during those six months.
I then looked for properties that had sold again.
After removing properties where additions, rebuilds or significant data changes made the comparison unreliable, I was left with 121 homes I could track cleanly.
Same property.
Bought near the peak.
Sold again.
Here is what happened:
Resale result | Share of clean repeat sales |
|---|---|
Sold more than 3% below the earlier purchase price | 64% |
Sold within roughly 3% of the earlier purchase price | 21% |
Sold more than 3% above the earlier purchase price | 14% |
Percentages are rounded.
The typical result was approximately 7% below the earlier purchase price.
That confirms part of the common story.
Buying near the 2022 peak did create real risk.
But it did not create the same result for everyone.
Some owners lost more than 30%.
Others recorded double-digit gains.
Same six-month buying period.
Same Central Okanagan detached market.
Very different outcomes.
The market average cannot tell you what happened to your house
The Association of Interior REALTORS® reported a Central Okanagan single-family benchmark price of $1,072,400 in July 2026.
You have to be careful comparing that number directly with older published benchmark figures.
The Association says its statistical methodology was standardized across its regions beginning in October 2024, and warns that older historical releases cannot be directly compared with newer monthly reports because of those methodology changes.
That is actually one reason I like looking at same-property resales.
Instead of asking what happened to an average or benchmark home, we can ask a simpler question:
What did this property sell for when it changed hands the first time, and what did that same property sell for later?
It still is not a perfect measurement.
Condition can change. Renovations happen. Transaction costs matter.
But it removes a lot of the mix problem that can make average prices difficult to interpret.
Six months mattered more than I expected
This was the part of the study that caught my attention.
I ran the same analysis on detached homes bought during the first half of 2021.
Among the homes from that group that eventually resold, 82% sold for more than their earlier purchase price.
For the comparable early-2022 group?
Only 14% sold for more than 3% above what they had paid.
You might assume the 2021 buyers simply held much longer.
They did hold longer, but not by a huge amount.
The typical early-2021 buyer in the repeat-sales group held for about 3.5 years.
The typical early-2022 buyer held for about 2.9 years.
That difference matters, but it probably does not explain an 82% versus 14% outcome by itself.
Purchase timing mattered.
Then the numbers changed again.
Among owners who bought during the second half of 2022 and later sold, almost half came out ahead.
That does not prove late 2022 was some perfect buying opportunity.
It shows how quickly the starting point changed.
“The market” is not enough information.
The price you paid matters too.
Is this kind of loss unusual?
I also wanted to know whether today's results were somehow different from previous flat real estate markets.
So I went back further.
I compared recent repeat sales with the long, relatively flat period that followed the 2007 market peak.
For owners who sold after holding their property for roughly two to three years:
2010 to 2015: about 30% sold more than 3% below what they had paid.
2024 to 2026: about 32% did.
Those numbers are remarkably close.
The lesson is not that the two markets are identical. They are not.
The lesson is that short ownership during a flat market has always carried more price risk.
Real estate transaction costs make the risk even larger.
A home can sell for the same amount you originally paid and still leave you behind after commissions, legal expenses, moving costs, financing costs, renovations and maintenance.
The longer holding periods tell a different story
The comparison gets more interesting as the holding period grows.
For properties sold after roughly five to seven years:
2010 to 2015: about 30% sold below their earlier purchase price.
Recent sales: about 1% did.
Same general holding period.
Very different result.
The likely explanation is the owners' starting point.
Many recent five-to-seven-year owners bought before the large 2020 and 2021 increase in Central Okanagan prices.
That earlier appreciation gave them a larger equity cushion before the market flattened.
Many owners selling five to seven years after the previous cycle had purchased much closer to the 2007 peak.
They had less of a cushion.
This is why a broad statement such as “prices are down” tells you very little about an individual homeowner.
Down from when?
And from what starting price?
Does time in the market really beat timing the market?
There is an old real estate saying:
Time in the market beats timing the market.
There is a lot of truth in it.
But I think the data adds an important second sentence:
You need enough time to get past the price you paid.
Across 27 years of Central Okanagan detached sales in my dataset, I found 4,348 properties that were owned for at least 10 years before being resold.
Only 10 sold for less than their earlier purchase price.
That is a powerful number.
It is not a guarantee.
It also does not mean every 10-year owner made a good financial return once mortgage interest, maintenance, renovations, property taxes and selling costs are considered.
But it shows how dramatically the risk of selling below your original purchase price has changed historically as the ownership period gets longer.
This does not mean every 2022 buyer is underwater
This is probably the most important limitation in the analysis.
The study can only observe homeowners who sold again.
It cannot tell us the current gain or loss of every person who purchased in 2022 and still owns the property.
That matters because the people who sell after two or three years may be different from the people who continue holding.
There are other limitations too.
I removed properties where obvious additions, rebuilds or major data changes made the comparison unreliable, but a dataset cannot perfectly measure every renovation, deterioration or difference in condition.
These figures also compare recorded sale prices before selling costs.
So I would not use this study to say:
“64% of 2022 buyers lost money.”
That goes further than the evidence allows.
What the data does tell us is narrower, and more useful:
Among the clean repeat sales I could track from the first half of 2022, selling within the next few years produced a loss far more often than a gain.
What does this mean if you bought near the peak?
Do not use the Okanagan average to decide whether your home has performed well or poorly.
Start with your property.
What did you pay?
What has changed about the home?
What have comparable properties actually sold for?
How long have you owned it?
What would selling cost?
And most importantly, what decision are you trying to make next?
Someone who bought for $900,000 and could sell for $850,000 may have a very different decision than someone who bought for $1.4 million and could sell for $1.32 million.
The percentage loss is only one part of it.
Equity, mortgage balance, next purchase, lifestyle and timeline all matter.
What does this mean if you are buying now?
I would not take this study as evidence that you should try to perfectly time the next bottom.
That is not what the data shows.
I would take something more practical from it.
Your expected ownership period matters.
If there is a good chance you will need to sell again in two or three years, the price you pay today deserves more attention.
You have less time for market appreciation to cover transaction costs or a flat period.
If you are buying something you could reasonably own for much longer, a short-term market move may matter less.
That does not mean overpaying is harmless.
It means price and time work together.
The question is not whether the market is up or down
The Central Okanagan market matters.
Interest rates matter.
Inventory matters.
Demand matters.
But none of them completely answers the homeowner's question.
Your result starts with the property you bought and the price you paid.
Then time gets involved.
That is why two people can buy in the same market, six months apart, and end up with completely different outcomes.
The headline might say Kelowna prices are up.
Or down.
Or flat.
Your house may have a very different story.
If you want to know how your home has actually performed, send me the property address.
I can compare it against the same-home data and show you where your property actually sits.
Not the average.
Yours.
This analysis uses MLS/Matrix detached-home sales for the Central Okanagan.
For the January through June 2022 study, 1,350 detached purchases were identified. Properties that later resold were matched back to their earlier transaction. Homes with additions, rebuilds or material data changes that made the comparison unreliable were removed, leaving 121 clean repeat-sale comparisons.
A resale more than 3% below the earlier purchase price was categorized as a decline. A result within approximately plus or minus 3% was categorized as roughly flat. A resale more than 3% above the earlier purchase price was categorized as a gain.
Sale-price changes are before commissions, legal expenses, renovations, maintenance, financing costs and other ownership or transaction costs.
Repeat-sales results describe properties that actually resold. They should not be interpreted as the current financial position of every homeowner who purchased during the same period.
Related articles to read: Okanagan Real Estate Market 2026 and Kelowna Home Values by Age study
Mark Coons Personal Real Estate Corporation
Mark Coons, BBA, CE
REALTOR® | eXp Realty Kelowna
Team Lead, Selling Okanagan Group
Relocated to Kelowna in 2018
778-946-6454
[email protected]