Where Are the Deals in Kelowna Real Estate in 2026?
It’s 2026 and everyone is asking the same question:
“Where are the deals in Kelowna real estate right now?”
This post breaks it down by property type and by neighbourhood — because the market isn’t one thing. Different areas across Kelowna and the Central Okanagan are doing completely different things, and knowing which is which is half the battle.
But here’s the truth:
The “best deal” isn’t always the best move.
A smart buy is a mix of:
-
Price
-
Long-term fit
-
How many other buyers are chasing the same property
Win on price but buy in the wrong spot, and you’ve traded one problem for another.
Trends matter too. Boomers retiring, the population aging, people rethinking what they need in a home — all of that can shift supply and demand faster than most buyers expect.
This is my way of helping you get ahead of the market — not catch up after everyone else already did.
Where Are the Deals in Kelowna? Start With This One Stat
There’s one number I track that tells me more than any headline:
Sold-to-Original-List-Price Ratio
(what homes actually sold for versus what sellers originally asked)
-
Higher ratio → sellers have the advantage, competition is real
-
Lower ratio → buyers have negotiating room
-
Below the 10-year average → buyers are getting better terms than this market has historically offered
Important note: a homeowner can ask whatever they want. That doesn’t mean a buyer is willing to pay it. This stat helps you understand how much negotiating is happening in the market — and how much room you may have when you write an offer.
And right now, across many neighbourhoods in the Central Okanagan, that ratio is sitting below its own 10-year norm.
That gap is the opportunity.
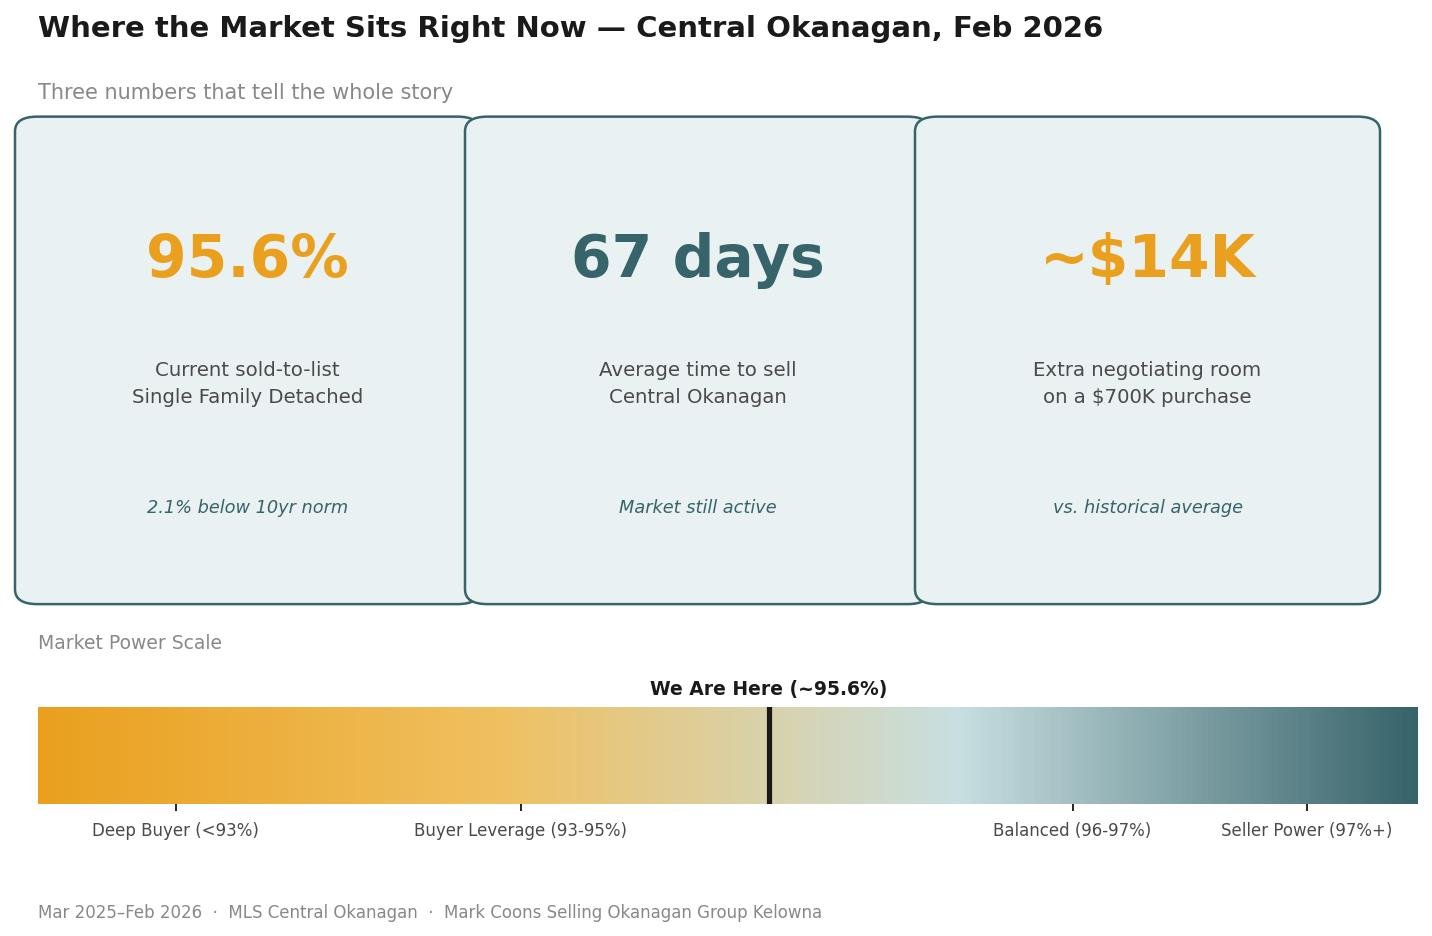
Where the Deals Are by Property Type in the Central Okanagan (MLS® Data)
Based on 10 years of MLS® data across the Central Okanagan and 2026 year-to-date sales, here’s what stands out.
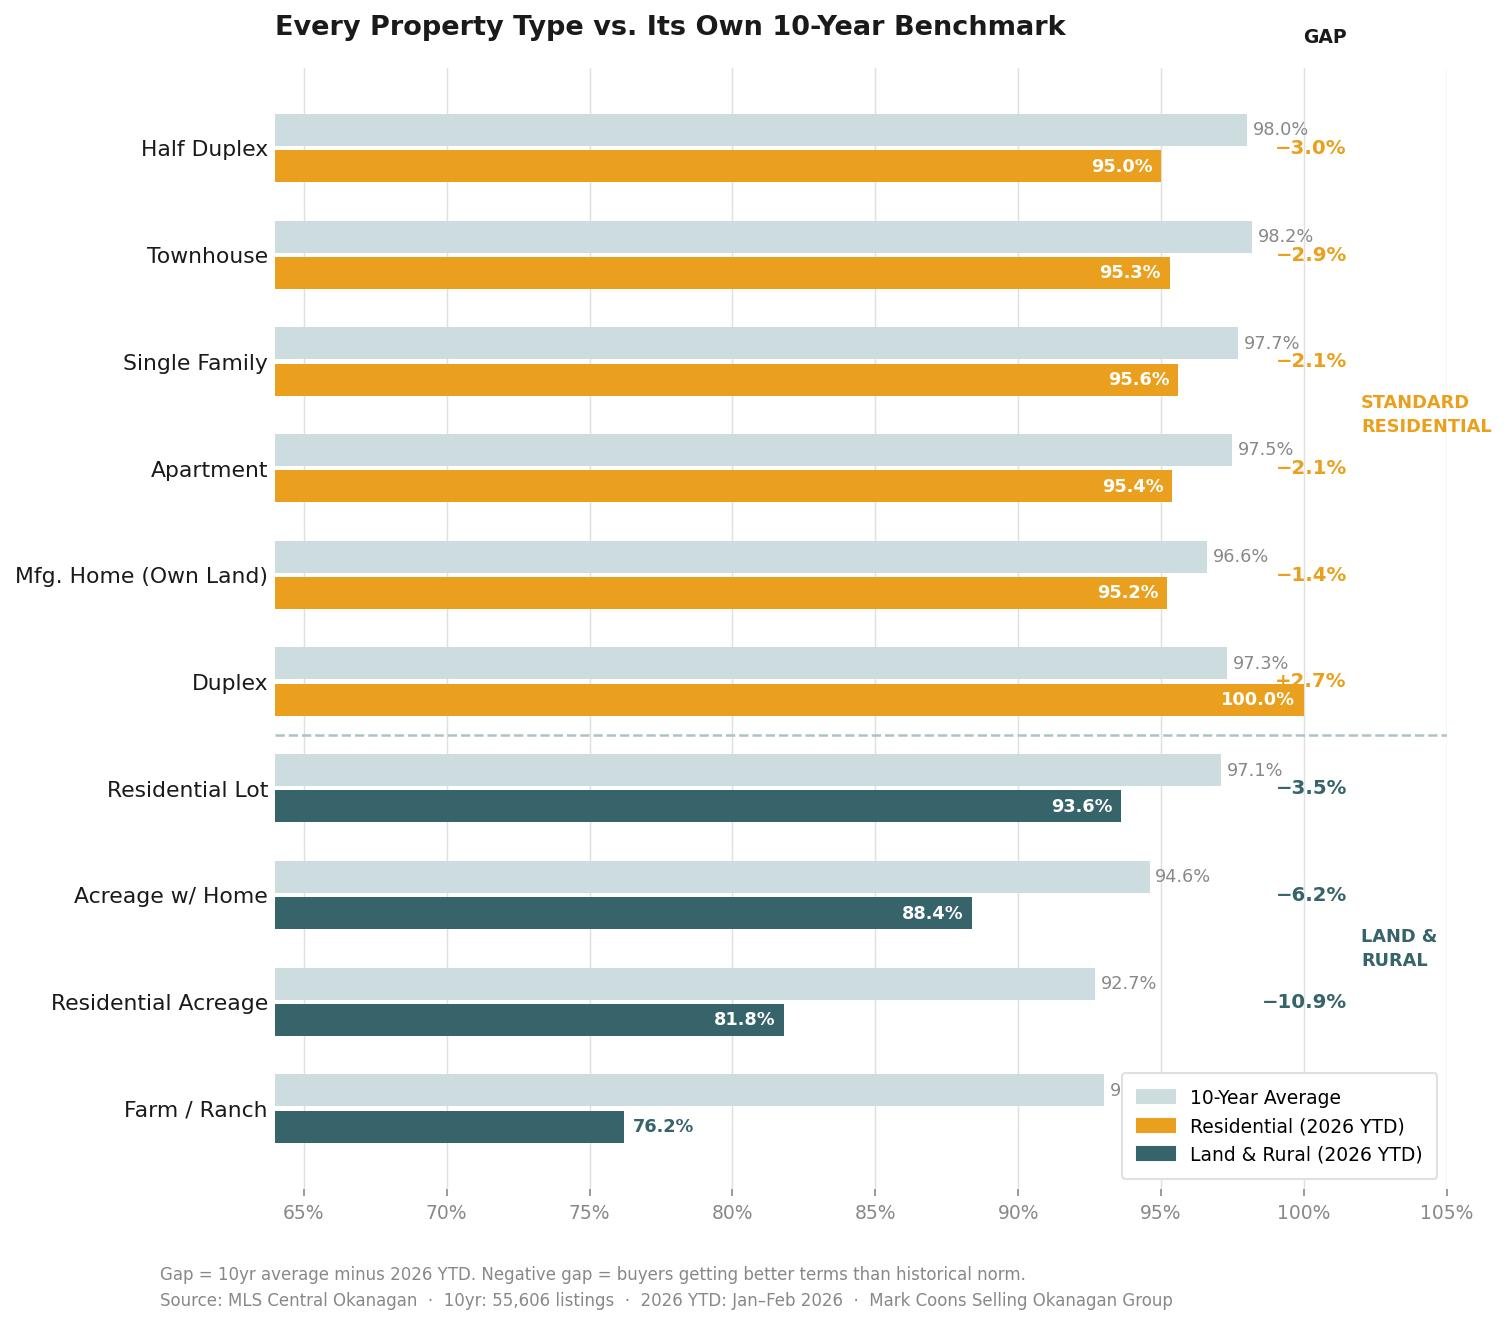
1) Standard residential is quietly softer
-
Single family detached: 95.6% YTD vs 97.7% 10-year average (-2.1%)
-
Townhouses: 95.3% vs 98.2% historically (-2.9%)
-
Half duplexes: ~3.0% below long-run average
These aren’t dramatic numbers at first glance — but on a $1,000,000 purchase, a 2–3% shift in negotiating power can be $20,000–$30,000.
2) Acreage and rural properties are the softest
-
Acreage with a home: 88.4% vs 94.6% 10-year average (-6.2%)
-
Residential acreage: 81.8% vs 92.7% historically (big gap)
This is structural softness in a category where fewer buyers compete.
My long-term filter is simple:
-
Acreage within ~20 minutes of Kelowna → demand likely returns over time
-
More remote land → be more careful (harder to resell if your plans change)
3) The outlier: hospitality and resort assets
-
Hospitality/resort: trading at 125% of original list price in 2026 YTD
-
Compared to a 107.3% 12-month average
That usually signals institutional or investor money moving early into tourism assets ahead of broader recovery. If you’re thinking long-term income-producing properties, that’s worth paying attention to.
Where the Neighbourhood Deals Are in Kelowna (And Which Ones Are Real)
This is where the analysis gets more useful.
I compared sold-to-list ratios across Central Okanagan sub-areas against their own 10-year averages.
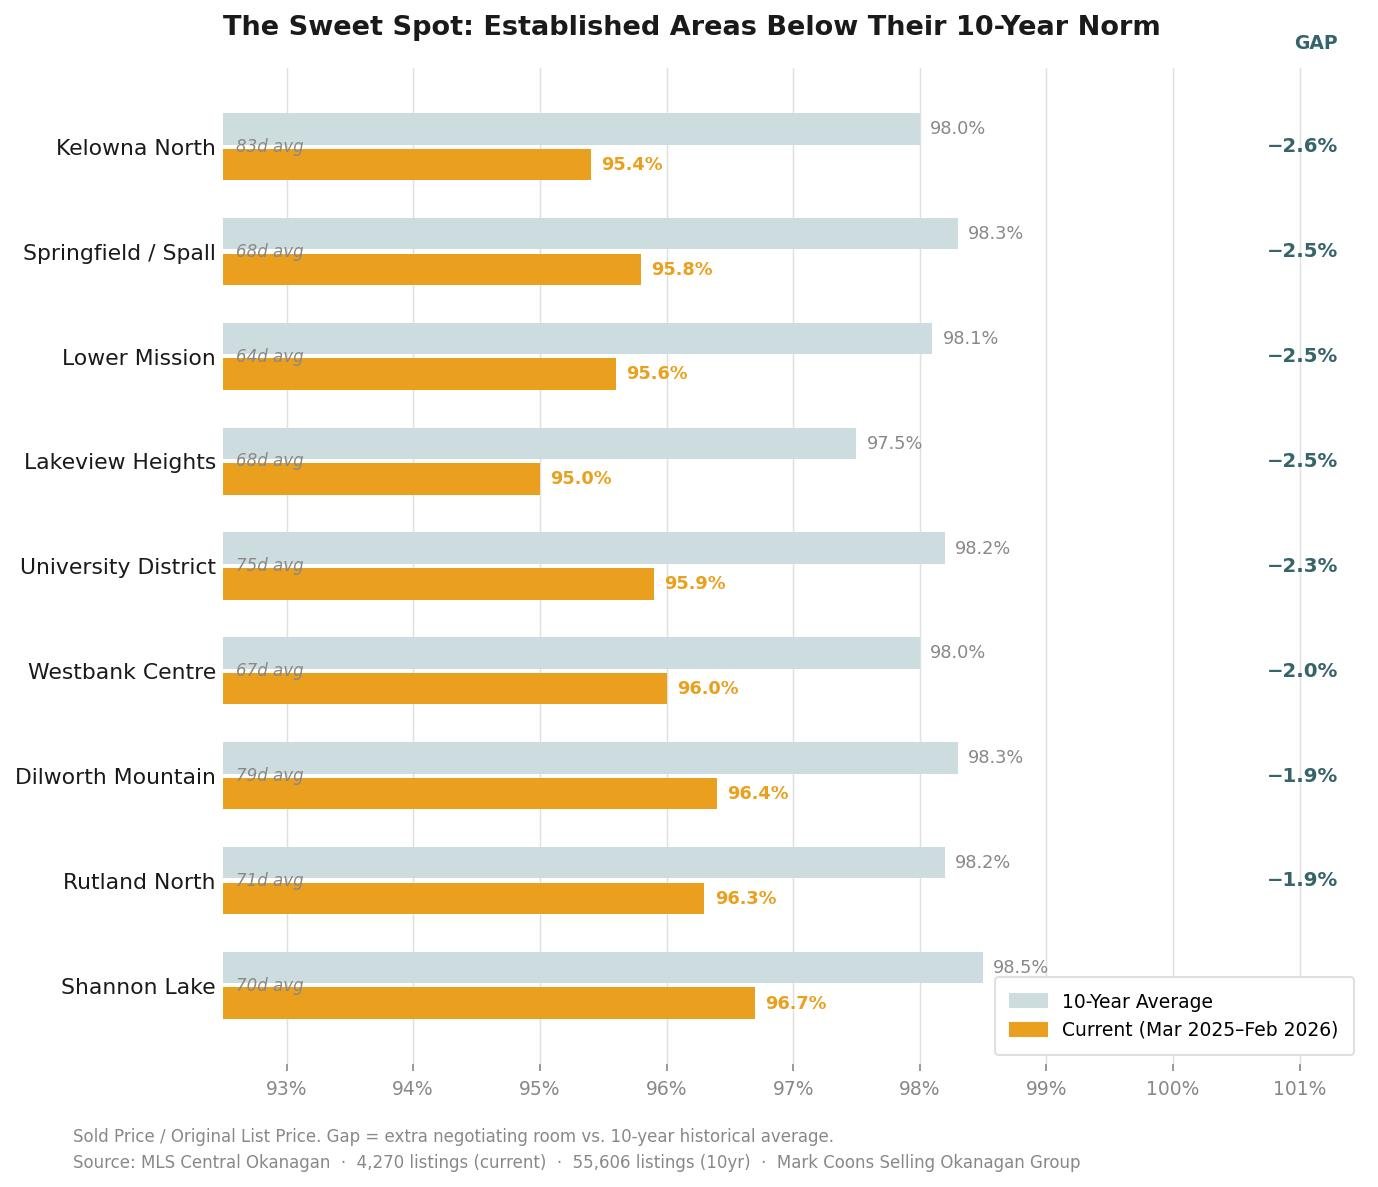
Based on 4,270 listings (March 2025 – February 2026) and 55,606 transactions over 10 years, here are the biggest “below normal” gaps:
Biggest gaps between normal pricing and today’s pricing
-
Kelowna North: 95.4% vs 98.0% (Gap -2.6%) | Avg 83 days to sell
-
Springfield / Spall: 95.8% vs 98.3% (Gap -2.5%) | Avg 68 days
-
Lower Mission: 95.6% vs 98.1% (Gap -2.5%) | Avg 64 days
-
Lakeview Heights: 95.0% vs 97.5% (Gap -2.5%) | Avg 68 days
-
University District: 95.9% vs 98.2% (Gap -2.3%) | Avg 75 days
These aren’t remote areas with tiny buyer pools. These are established, in-demand neighbourhoods.
That’s why this matters:
A discount in a strong area often means the market corrected, but hasn’t fully reset yet.
That’s usually where real opportunity shows up.
The Two-Variable “Deal Test” I Use
A discount alone doesn’t make something a deal. I use two variables together:
1) How far below the 10-year average is the ratio?
This tells me how unusual today’s pricing is compared to what’s historically normal.
2) How long is it taking homes to sell?
This tells me how liquid the market is — and how easy it may be to resell later.
The sweet spot: below historical norms and selling in a reasonable timeframe.
Right now, Springfield/Spall, Lower Mission, Lakeview Heights, and University District land in that zone.
The warning sign example:
Christian Valley/Westbridge is around 81.3% sold-to-list and averages roughly 254 days to sell.
That discount is real — but so is the illiquidity.
If your timeline changes and you need to sell, that’s a very different risk than selling in an established Kelowna neighbourhood.
For Developers and Builders: Where the “Deal” Is for Infill Multifamily in Kelowna (2026)
If you’re looking at Kelowna infill multifamily (duplex, fourplex, sixplex, small apartments), the “deal” is rarely just price.
A real development deal usually comes from:
-
Land that pencils (purchase price + carrying + time)
-
Zoning + density potential (what you can actually build)
-
Exit demand (end-user vs rental vs investor)
-
Speed to permits (time is money)
If you’re a builder, developer, or landowner considering infill, here’s the fastest way to get clarity:
Send me:
-
the address (or area)
-
what you think it can be (duplex/fourplex/6-plex/etc.)
-
your target (sell vs hold)
I’ll tell you what I’d check first — and what could kill the deal early.
Bottom Line: Are There Deals in Kelowna in 2026?
Yes — and the data supports it.
Across many established neighbourhoods in the Central Okanagan, sold-to-list ratios are below their own 10-year averages.
In plain English:
buyers are negotiating better deals right now than this market has typically allowed.
This is not a prediction about where prices go next.
It’s a snapshot of how much room exists at the table today compared to what’s historically normal.
And right now, that room is real.
Want Me to Apply This to Your Situation?
Stats only matter if you use them — so here’s how we put this into action.
Reply with:
-
Your budget
-
Your purpose (live in long-term, rental, short-term rental, investment, farmland, builder project, etc.)
Based on that, I’ll personally send you 3 active listings worth looking at right now — matched to where the data says the opportunity actually is for your situation.
That’s it. No pressure. Just reply.
Mark Coons, BBA, CE
REALTOR® | eXp Realty Kelowna
Team Lead, Selling Okanagan Group
Relocated to Kelowna in 2018
📞 778-744-0872
📩 [email protected]