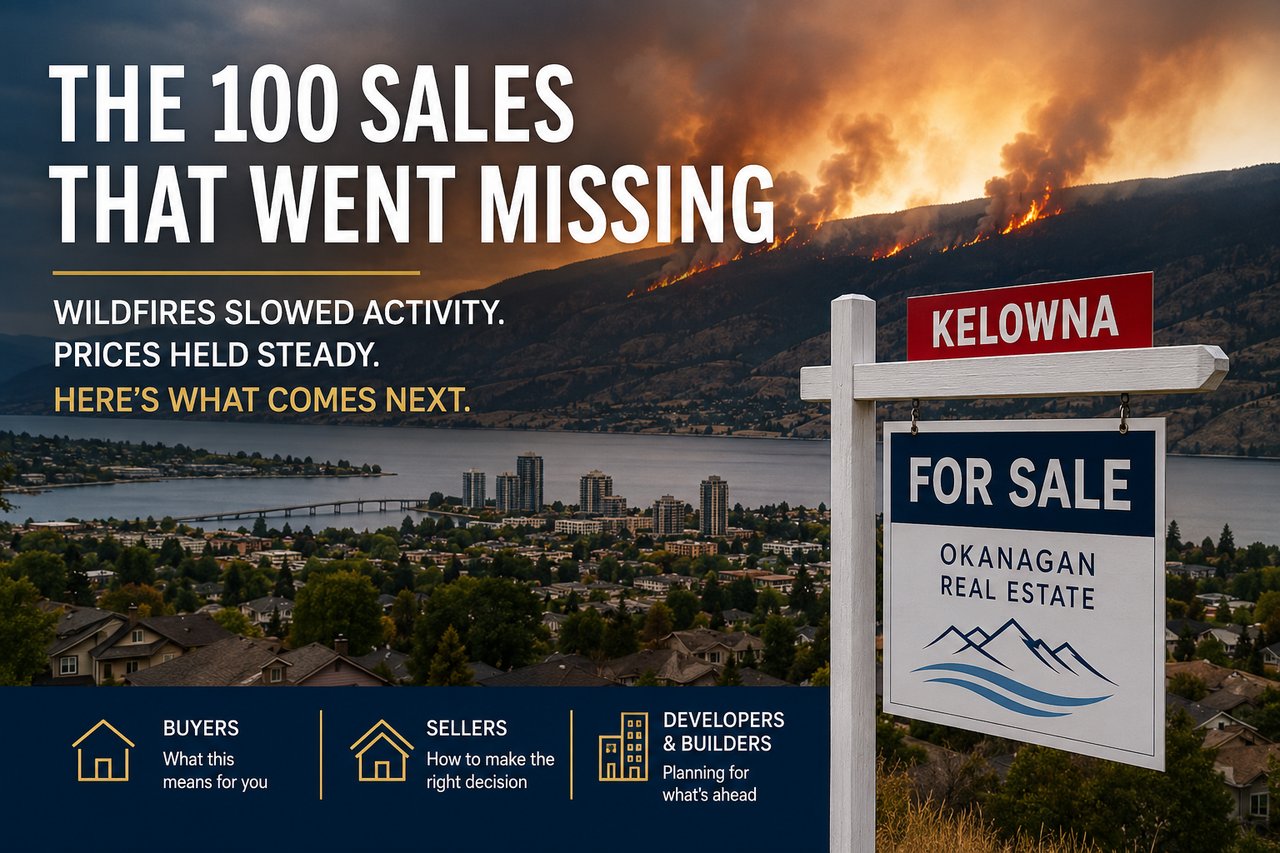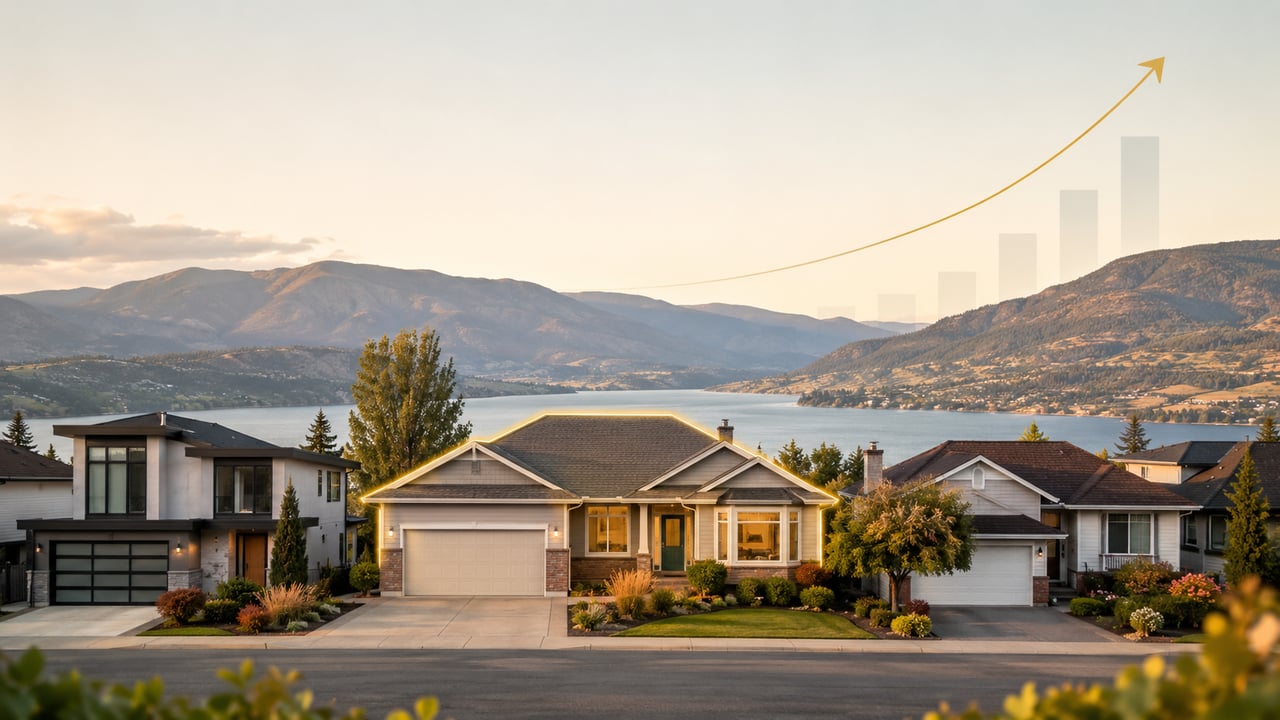
Why Are 1990s Homes Quietly Outperforming in the Kelowna Real Estate Market?
Happy Wednesday.
The latest Q2 housing numbers for the BC Interior showed something interesting.
The Central Okanagan real estate market remains about 13% below its previous record high, while some Interior markets have recovered much more of their losses.
But a regional number does not tell you what happened to your Kelowna home.
A house built in 1965 is not competing with the same buyer as a house built in 2015.
So I pulled 2,013 detached home sales across the Central Okanagan from August 1, 2025 through July 31, 2026, along with 1,430 detached homes currently for sale, and sorted them by the decade they were built.
One group kept showing up ahead of the others:
Homes built in the 1990s.
And no, it is not because buyers suddenly love oak cabinets.
Quick Answer: Why Are 1990s Kelowna Homes Holding Their Value Better?
Based on the sales I analyzed, 1990s homes appear to sit in a useful middle ground.
They are generally:
- Much cheaper than homes built in the 2000s or 2010s
- Large enough for families
- More likely to have already been renovated
- Often equipped with suites or mortgage helpers
- Priced closer to where buyers are actually willing to purchase
Once I adjusted the data for neighbourhood and home size, 1990s homes were down about 7.6% from Q2 2022 to Q2 2026.
That was the smallest decline among the age groups I studied.
But there is another finding that matters even more.
The age of a home had very little impact on how much buyers negotiated. Time on market mattered far more.
Let me show you.
Kelowna Detached Home Prices by Age
Here is where recent Central Okanagan detached home sales landed:
- 1980s homes: median $835,000 | 2,267 sq. ft.
- 1990s homes: median $867,000 | 2,332 sq. ft.
- 2000s homes: median $1,012,500 | 2,836 sq. ft.
- 2010s homes: median $1,289,000 | 3,142 sq. ft.
The jump between a typical 1990s home and a 2000s home is significant.
For many Kelowna buyers, that difference changes the entire affordability calculation.
What Does a Newer Kelowna Home Cost Per Month?
Using 20% down, a 4.5% mortgage rate and a 30-year amortization, the approximate monthly payments look like this:
- 1990s home: $3,514/month
- 2000s home: $4,104/month
- 2010s home: $5,225/month
- 2020s home: $6,003/month
Moving one decade newer from the 1990s to the 2000s adds roughly $590 per month.
Moving from a 1990s home to a 2010s home adds around $1,711 per month.
For many Kelowna home buyers, that is not just a lifestyle decision.
It can be the difference between qualifying for the mortgage and not qualifying at all.
Many 1990s Homes Have Already Been Renovated
There is another reason these homes may be appealing.
Renovations were mentioned in approximately:
- 52% of 1990s home sales
- 32% of 2000s home sales
- 13% of 2010s home sales
The buyer logic is fairly simple.
A 1990s home is not new.
But the previous owner may already have replaced the roof, updated the kitchen, installed new flooring, changed the windows or dealt with some of the major mechanical systems.
That can give buyers some of the benefits of an updated home without paying the premium attached to newer construction.
There is an important warning here.
MLS listing remarks can tell us that a renovation was mentioned. They cannot tell us the quality of the work, how extensive it was or whether permits were required and obtained.
The data supports the theory.
It does not prove that every renovated 1990s home is a better purchase.
Suites and Mortgage Helpers Still Matter
These homes are not outperforming because they rarely have secondary suites either.
About 52% of recent 1990s detached sales mentioned a suite or mortgage helper.
That was higher than the 1980s group and only slightly below homes built in the 2000s.
With today's mortgage payments, a basement suite can materially change what a buyer can afford.
That makes certain 1990s neighbourhoods particularly interesting for buyers trying to balance:
purchase price + monthly payment + usable space + rental income.
There Are Plenty of 1990s Homes for Buyers to Choose From
Scarcity is not driving this either.
At the time of my analysis, there were approximately:
- 236 active 1990s detached listings
- 427 sales over roughly the previous year
That makes the 1990s one of the larger sections of the Central Okanagan detached housing market.
These homes are not holding up because buyers have no other options.
Buyers appear to be actively choosing them.
How Much Have Kelowna Homes Fallen From the 2022 Peak?
This is where I found something important in my own data.
The raw numbers originally suggested 1990s homes were down only about 1.5% per square foot from Q2 2022.
That looked impressive.
It was also misleading.
Once I compared homes within similar neighbourhoods and similar size ranges, the picture changed.
From Q2 2022 to Q2 2026:
- 1990s: down approximately 7.6%
- 1980s: down approximately 9.0%
- 2010s: down approximately 9.5%
- 2000s: down approximately 10.4%
- 1970s: down approximately 10.8%
- Pre-1970: down approximately 20.0%
The 1990s still came out ahead.
But the difference between most decades is only a few percentage points.
Most of the huge advantage that appeared in the raw data came from which houses and which Kelowna neighbourhoods happened to sell, rather than the decade alone.
That distinction matters.
The 1990s did not escape the real estate correction.
They simply experienced a smaller version of it.
Why Are Older Kelowna Homes Struggling?
The biggest weakness appears at the other end of the market.
Homes built before 1970 were down around 20% in the adjusted analysis and were carrying approximately 19 months of inventory.
Homes built from the 1970s through the 1990s were closer to seven months.
Why such a big difference?
One reason may be redevelopment.
Development Potential Is Not Worth What It Was in 2022
Development or density potential was mentioned in approximately 62% of Q2 2026 pre-1970 sales.
Compare that with:
- 24% of 1990s sales
- Around 11% to 12% of 2000s and 2010s sales
Many older Kelowna properties are still being marketed partly for their land value, zoning or future redevelopment potential.
That creates a problem.
The property can end up stuck between two different buyers.
The regular home buyer looks at:
- The old kitchen
- The roof
- Plumbing
- Electrical
- Windows
- Energy efficiency
- Renovation costs
The developer looks at:
- Land cost
- Construction costs
- Development Cost Charges
- Financing
- Interest carry
- Soft costs
- Taxes
- Required profit
- Finished unit values
If the numbers do not work for either group, both buyers walk away.
That is exactly why simply having infill or multifamily development potential in Kelowna does not automatically make a property valuable to a builder.
The project economics still have to work.
What This Means for Kelowna Developers and Infill Home Builders
This may be one of the more important signals in the data.
Developers looking at older Kelowna properties should be careful about using the previous real estate cycle's land values.
A property may have:
- MF1 or multifamily zoning
- Transit-oriented potential
- Future land-use support
- Multiple-unit development potential
- A large lot
- An older house with limited remaining economic life
None of those automatically make it a good development site.
The real question is:
What can be built, what will it cost and what can the finished units realistically sell for in today's market?
If the residual land value does not support the seller's asking price, zoning alone will not rescue the deal.
That may help explain why some older Kelowna properties with redevelopment potential continue sitting on the market.
Does an Older Home Give a Buyer More Negotiating Power?
This was one of the biggest surprises in the entire analysis.
Not really.
Median negotiation off the final asking price was:
- Pre-1970: 5.1%
- 2000s: 4.0%
- 1990s: 3.9%
- 2010s: 3.8%
- 1970s: 3.7%
- 1980s: 3.6%
- 2020s: 3.5%
Take out the pre-1970 properties, which behave differently because of renovation and redevelopment factors, and almost every decade lands between 3.5% and 4.0%.
The age of the house barely changes the negotiation.
So what does?
Time.
Days on Market May Be the Best Negotiating Signal for Kelowna Buyers
Look at the relationship between days on market and the final selling price.
Homes that sold:
- At or above asking: median 18 days on market
- 0% to 2.5% below asking: 26 days
- 2.5% to 5% below asking: 45 days
- More than 5% below asking: 71 days
Now look at it from the other direction.
Typical negotiation based on how long the property had been listed:
- First 30 days: 2.1%
- 31–60 days: 4.2%
- 61–90 days: 4.7%
- More than 90 days: 6.4%
That is a much clearer relationship than the age of the house.
Price Reductions Did Not Solve the Problem
This may be the most useful number for Kelowna home sellers.
Homes that never had a price reduction:
- Sold in a median 40 days
- Sold approximately 3.6% below asking
Homes that required a price reduction:
- Sat for a median 106 days
- Still sold approximately 6.3% below the reduced asking price
- Total discount from the original asking price: approximately 10.1%
The price reduction did not suddenly create leverage for the seller.
It simply started another round of negotiations.
Why Pricing a Kelowna Home Correctly From Day One Matters
For sellers, the first few weeks on the market matter enormously.
Buyers watch new listings closely.
When a property launches at a price the market understands, it has the best chance of creating competition.
When it launches too high, buyers often wait.
Then the listing gets older.
Then comes the reduction.
Then buyers start asking:
"What's wrong with it?"
That is why chasing the market downward can be more expensive than pricing properly at the beginning.
Almost 6 in 10 Kelowna Detached Listings Are Asking Above Recent Sell-Through Levels
I also compared every active detached listing against the median sold price per square foot for homes from the same decade.
Of the 1,430 Central Okanagan detached homes currently for sale:
- 27.3% were asking more than 5% below their decade's sell-through rate
- 14.0% were within 5%
- 58.7% were asking more than 5% above it
Nearly six out of every ten listings were asking substantially more per square foot than what comparable-aged homes had recently been selling for.
That does not mean all of those homes are overpriced.
Price per square foot cannot properly account for:
- Neighbourhood
- Lake views
- Lot size
- Renovations
- Pools
- Suites
- Development potential
- Condition
- Layout
- Privacy
- Finish quality
Some homes deserve a premium.
But when almost 60% of the market is asking above recent sell-through levels, it helps explain why inventory is staying elevated.
1990s Homes Appear to Be Priced More Realistically
For homes built in the 1990s, approximately 51.5% were priced more than 5% above their sell-through rate.
That was the lowest percentage of any decade from the 1970s through the 2010s.
This may be one of the simplest explanations for their relative strength.
Their negotiation pattern is not dramatically different.
Their asking prices are simply closer to where buyers are already willing to act.
Once adjusted for neighbourhood and size:
- 1990s listings near their sell-through rate had a median of 49 days on market
- Listings priced more than 5% above it had a median of 71 days
Pricing still mattered more than age.
Is a Low Price Per Square Foot Automatically a Good Deal?
No.
This was another useful finding.
Homes priced more than 5% below their decade's sell-through rate did not sell the fastest.
They had been on the market for a median of around 63 days.
Why?
Some are larger homes, which naturally trade at a lower price per square foot.
Others may have:
- Poor layouts
- Major renovation needs
- Location issues
- Busy roads
- Steep driveways
- Deferred maintenance
- Less desirable lots
This is why buyers need to be careful when looking at one simple real estate metric.
Cheap per square foot does not automatically mean good value.
What Should Kelowna Home Sellers Do?
If you are selling a home in Kelowna or the Central Okanagan, the data points toward one clear strategy:
Treat your first 30 days seriously.
Homes priced properly from the beginning gave up around 3.6% and sold in approximately 40 days.
Homes that started too high eventually gave up around 10.1% from their original asking price and spent roughly 106 days getting there.
There are always exceptions.
But there is little evidence here that deliberately starting high creates a better outcome.
What Should Kelowna Home Buyers Do?
Use the clock.
A new listing may only have around 2% negotiating room.
Once it has been listed for 30 to 60 days, the historical pattern moves closer to 4%.
Past 90 days, it was around 6%, with some properties going much further.
That does not mean a buyer should automatically offer 6% below asking on every 90-day listing.
Every seller has a different motivation.
But days on market gives you a much stronger starting point than simply saying:
"The house is old, so let's offer less."
What If You Own a 1990s Home in Kelowna?
Based on this dataset, you may currently be sitting in one of the better relative positions in the detached housing market.
1990s homes were still down approximately 7.6% from Q2 2022 after adjusting for neighbourhood and size.
They were not immune from the correction.
But they experienced the smallest decline of the age groups I studied.
Affordability, renovations, suites, usable square footage and realistic seller expectations may all be contributing.
What If You Own a Pre-1970 Kelowna Home?
This market requires a different strategy.
If you have been valuing your property mainly because of its development or land potential, today's numbers suggest being cautious.
Approximately 19 months of inventory is a major signal.
The development buyer may still exist.
But the price needs to work after accounting for construction costs, financing, taxes, municipal charges and realistic resale values.
A zoning designation tells you what may be possible.
It does not tell you what the land is worth.
Frequently Asked Questions About Kelowna Home Values
Are 1990s homes a good buy in Kelowna?
They can be. In this analysis, 1990s homes offered a combination of lower prices than newer homes, relatively large floorplans, frequent renovations and a high percentage of suites or mortgage helpers. Individual condition and location still matter much more than the year alone.
Are older homes easier to negotiate on?
Not necessarily. Excluding pre-1970 properties, homes from different decades typically sold around 3.5% to 4.0% below their final asking price.
What gives Kelowna buyers the most negotiating power?
Days on market was one of the strongest signals in this dataset. Homes listed longer tended to sell at larger discounts.
Should a Kelowna seller start high and reduce later?
The numbers suggest caution. Homes that required a price reduction took much longer to sell and ultimately experienced a larger total discount from their original asking price.
Is price per square foot a good way to value a Kelowna home?
It is useful as one comparison tool, but it should never be used alone. Lot, neighbourhood, view, condition, size, suite, layout and development potential can create major differences between two homes with the same price per square foot.
Are older Kelowna properties still valuable for infill development?
Some absolutely are, especially where zoning and location support additional density. But builders need to work backward from realistic finished-home values and construction costs to calculate what the land is actually worth.
The Biggest Lesson From 2,013 Kelowna Home Sales
The most surprising finding was not that 1990s homes performed well.
It was this:
Buyers are not getting dramatically larger discounts because a home is older.
They are getting larger discounts when the seller has been waiting long enough to move.
The strongest predictor of negotiating room was not the age of the house.
It was how long the seller had been on the market.
If you want to know where your specific property sits compared with the sell-through rate for its decade, size and Kelowna neighbourhood, send me the address.
I will run the numbers.
That comparison may help tell us whether your home looks more like the properties selling in 40 days or the ones taking more than 100.
And if the numbers say selling right now does not make sense, I will tell you that too.
Mark & Maddie Coons
Selling Okanagan Group | eXp Realty Kelowna
778-946-6454
[email protected]
Notes on the numbers: Based on 2,013 detached sales in the Central Okanagan from August 1, 2025 through July 31, 2026, and 1,430 active detached listings. Source: MLS Matrix. Median price per square foot is used instead of average because luxury sales and redevelopment properties can distort averages. Negotiation is measured against final asking price unless the original asking price is specifically stated. Thirteen sales with malformed previous-price data were excluded from negotiation calculations. Suite and renovation figures are based on listing remarks and indicate only that a feature was mentioned; they do not verify quality, scope, permits or legality. Q2 2022 to Q2 2026 price changes were adjusted for neighbourhood and home size. Mortgage-payment figures assume 20% down, a 4.5% interest rate and a 30-year amortization and exclude property taxes, insurance and other ownership costs. Regional Q2 2026 figures are from the Association of Interior REALTORS.