Is the Kelowna Real Estate Market Slowing Down? September 2026 Shows Why the Answer Depends on Price
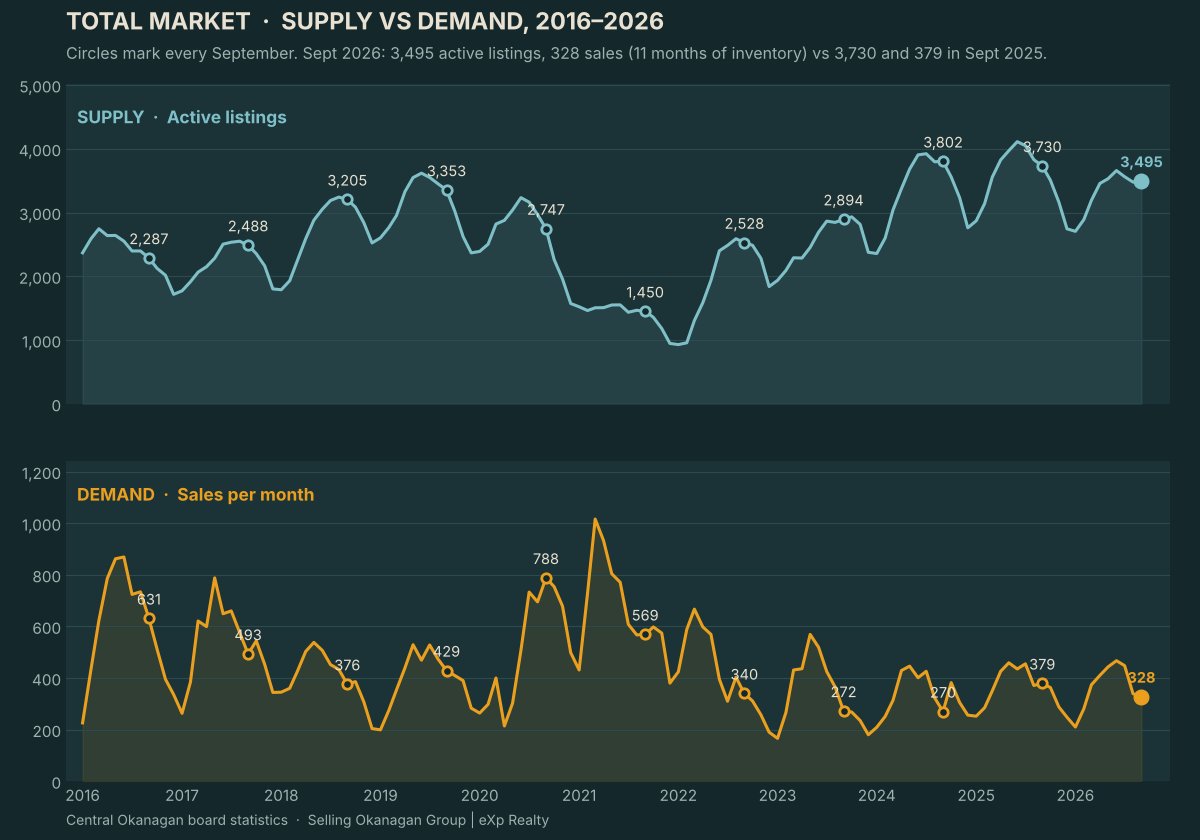
Yes, the Central Okanagan real estate market was slow in September 2026.
There were 320 residential sales, about 13% fewer than last September. Homes are also generally taking longer to sell.
But that does not mean prices are falling everywhere.
That is the part I think gets missed when we talk about “the Kelowna market.”
Once you separate detached homes, townhomes, apartments and different price ranges, September looks less like one slow market and more like several very different markets happening at the same time.
Fewer sales did not automatically mean lower prices
Normally, when we hear that sales are down, it is easy to assume prices must be falling too.
September is a good example of why that conclusion can be misleading.
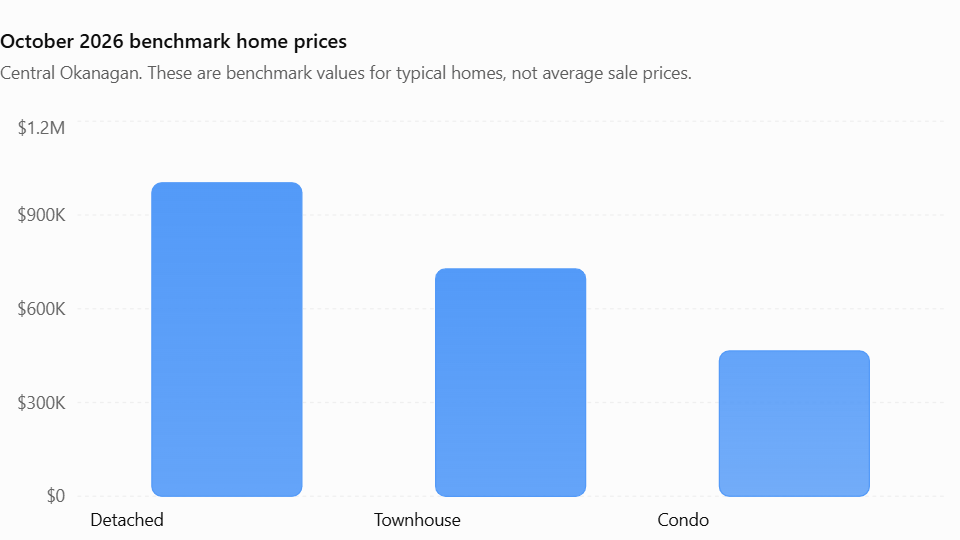
Single-family homes had fewer sales than a year ago, but the median sale price in my September dataset was $990,000, up 5.3% from September 2025.
Why?
Supply is part of the answer.
New single-family listings were down about 21% year over year, while active single-family inventory was down roughly 16%.
So yes, there were fewer buyers.
But there were fewer sellers competing for those buyers too.
That matters.
A slower market does not automatically create lower prices if the supply side is tightening at the same time.
The bigger story is hiding inside the price ranges
This is where I think the September numbers become much more useful.
Looking at an average for all detached homes can make two homeowners think they are in the same market when they really are not.
In my September price-band analysis, single-family homes priced below $800,000 had roughly 4 months of inventory.
Between $800,000 and $1 million, there were roughly 5 months of inventory.
Move above $2 million and the market changes considerably.
That means a homeowner selling for $775,000 could be competing in a much tighter market than someone selling a few kilometres away for $2.5 million.
Same Central Okanagan.
Completely different competition.
This is why I would be careful using one average price, one sales number or even one months-of-inventory number to decide whether it is a “good” or “bad” time to sell.
The better question is:
What is happening around homes that actually compete with yours?
Townhomes are the segment I am watching
If there is one part of the September market I would keep a closer eye on, it is townhomes.
There were 46 townhome sales during September.
More interesting to me is what happened before those properties sold.
Almost half of the townhomes that sold during September finished more than 5% below their original asking price.
That does not mean every townhome seller needs to cut their price.
It does tell us something about how buyers are behaving.
They appear willing to wait when the value is not obvious.
For buyers, that may create negotiating opportunities, especially on properties that have been sitting or have already adjusted their price.
For sellers, it puts more pressure on getting the starting position right.
There is a big difference between negotiating because that is normal in your segment and spending weeks chasing the market down from an unrealistic starting price.
What about apartments?
Apartments were also slow.
There were 83 apartment sales in my September dataset, with a median sale price of $423,000.
The median apartment took 83 days to sell.
That is important context for both sides.
A buyer seeing a condo that has been listed for 60 or 70 days should not automatically assume something is wrong with it. Longer selling times have become more common.
At the same time, a seller should not assume that more time will automatically solve a pricing problem.
Days on market only becomes useful when you compare it with the competition, showing activity, price changes and what similar properties are actually selling for.
September wasn't simply a buyer's market or seller's market
This is probably my biggest takeaway from the month.
I don't think describing the entire Central Okanagan as a buyer's market or seller's market is particularly useful right now.
There are pockets where buyers have plenty of leverage.
There are others where inventory is surprisingly limited.
And there are price ranges where sellers are competing for a much smaller pool of buyers.
That is why two people can have completely different experiences at exactly the same time.
One seller may receive strong activity in the first two weeks.
Another property type or price range may take months.
One buyer may have several similar homes to choose from and room to negotiate.
Another may find that the type of home they want still has very little competition.
What I would watch next
The number I am most interested in over the next couple of months isn't simply the average sale price.
I want to see what happens to inventory.
If sales stay slow but the number of homes for sale continues to decline, that could help support prices in some segments.
If inventory begins building again while sales remain weak, sellers may face more competition.
I am also watching townhomes closely to see whether the gap between original asking prices and eventual sale prices continues.
One month can show us something interesting.
It takes more than one month to call it a trend.
What does this mean if you're selling?
Start with your competition, not the Central Okanagan average.
Look at your property type, neighbourhood and realistic price range.
Then ask:
How many similar homes are actually for sale?
How many are selling?
How long are they taking?
Which properties are getting reduced?
And what are buyers ultimately paying?
Those numbers will tell you far more about your position than the average Kelowna sale price.
What does this mean if you're buying?
A slow market can create opportunity, but I would not assume every seller is desperate to negotiate.
The amount of leverage you have depends heavily on the segment.
A property competing against ten reasonable alternatives is different from one of only two homes that fit what you need.
Look at the property first.
Then look at its competition.
Then look at the market around it.
That is where the useful information usually is.
Explore the market yourself
I built an Okanagan Market Dashboard so you can dig deeper into the numbers instead of relying on one market headline.
You can explore different areas, property types and market segments to see what is actually happening in the part of the Okanagan that matters to you.
And if you want me to narrow the analysis down to your home, neighbourhood or price range, send me the address or the segment you're watching.
Methodology and data note
The broad September residential sales figure comes from the Association of Interior REALTORS® Central Okanagan reporting for September 2026.
Additional median-price, days-on-market and price-band observations in this article come from my own September market analysis. Different datasets can produce slightly different totals depending on which residential property categories and filters are included.
Market statistics describe what happened across a group of properties. They do not determine the value of an individual home.
Mark Coons Personal Real Estate Corporation
Mark Coons, BBA, CE
REALTOR® | eXp Realty Kelowna
Team Lead, Selling Okanagan Group
778-946-6454
[email protected]