Q3 2026
Central Okanagan market: sales fell 13.2% regionwide, but detached, townhouse and condo benchmarks moved differently. AIR data explained.
The Okanagan housing market slowed during the third quarter of 2026. But if you only look at sales, you might miss the most useful part of the story: different property types are moving in different directions.
The Association of Interior REALTORS® (AIR) reported 2,145 residential sales across the Okanagan region in Q3, down 13.2% from Q3 2025. Dollar volume was approximately $1.7 billion, down 10.5%. August had just 618 sales, the lowest August total since 2011, according to AIR.
And yet, by September the region had 5,755 active residential listings, 10.2% fewer than a year earlier. There were 4,181 new listings in Q3, down 19.7%. In other words, buyers stepped back—but so did many sellers.
Watch my Q3 market breakdown
Watch the Q3 2026 Kelowna real estate market video on YouTube
In this 11-minute breakdown, I walk through AIR's report, the buyer-seller standoff, and why a market headline cannot tell you what your own home is worth.
Central Okanagan: three markets, three different results
Property type | September 2026 benchmark | Change from a year earlier | Q3 sales | Sales change |
|---|---|---|---|---|
Single-family, excluding lakefront and acreage | $1,057,200 | +3.4% | 496 | −3.1% |
Townhouse | $696,600 | −5.5% | 158 | −2.5% |
Condo/apartment | $496,700 | +2.0% | 286 | −10.1% |
Important: The headline decline of 13.2% refers to all residential sales in the wider Okanagan, not to Central Okanagan sales alone. The table above reports Central Okanagan property categories separately.
Why haven't all prices dropped with sales?
AIR describes a gap between what buyers are willing to pay and what sellers are willing to accept. Some buyers are concerned about jobs, mortgage costs and affordability; some owners are choosing not to list, or not to reduce prices. That helps explain why fewer transactions do not automatically mean prices fall equally everywhere.
A benchmark is designed to represent a typical home in a category. It does not mean every home has changed in value by that percentage. Your location, condition, price range and competition still matter.
The economy is part of the story
The AIR report puts regional unemployment at 7.7% in September 2026 and notes that home prices remain roughly six to seven times annual household income. It also points to slower projected household growth. Those are reasons to be cautious about predicting a rapid market rebound—even if some benchmark prices are up.
What would I do with this information?
If you're selling, I would compare your property with the homes buyers can choose today, not rely on a region-wide growth percentage. If you're buying, I would focus on the property type and neighborhood rather than waiting for a single overall market signal. And if you're selling a detached home to downsize into a townhome, the gap between those two markets may matter more than either headline price.
My takeaway: This is not simply an “up” or “down” market. It is a market where your property type and reason for moving deserve more attention than the headline.
If you want to see how Q3 conditions apply to your own home or next purchase, contact me at 778-946-6454.
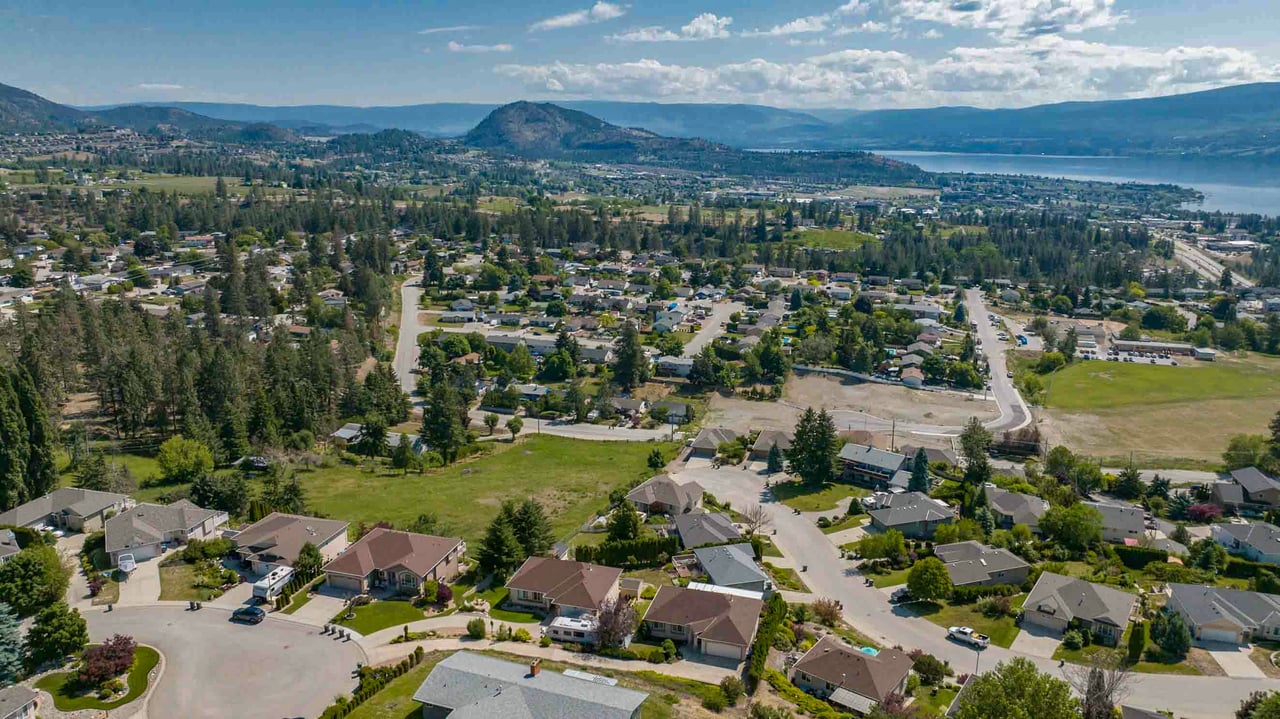
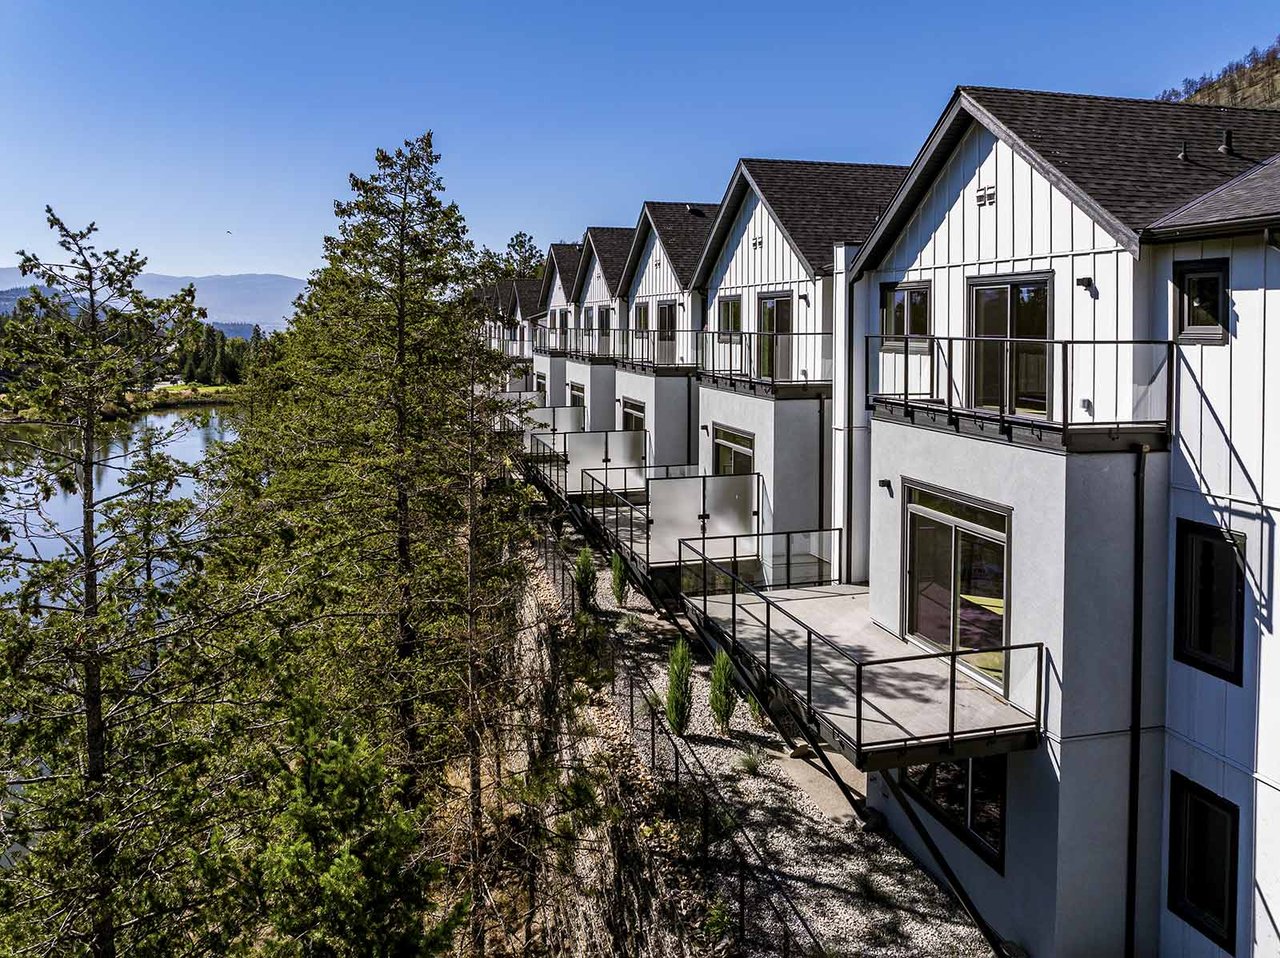
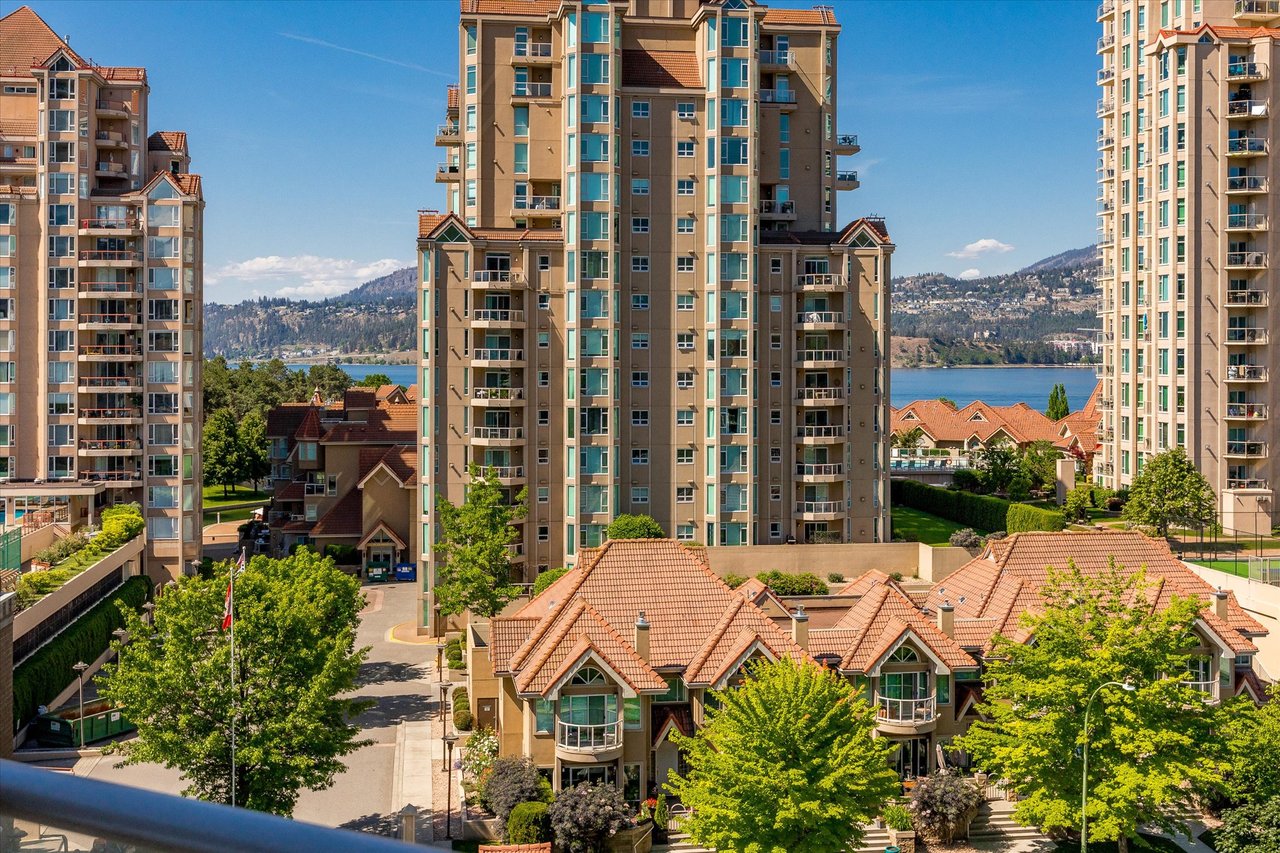
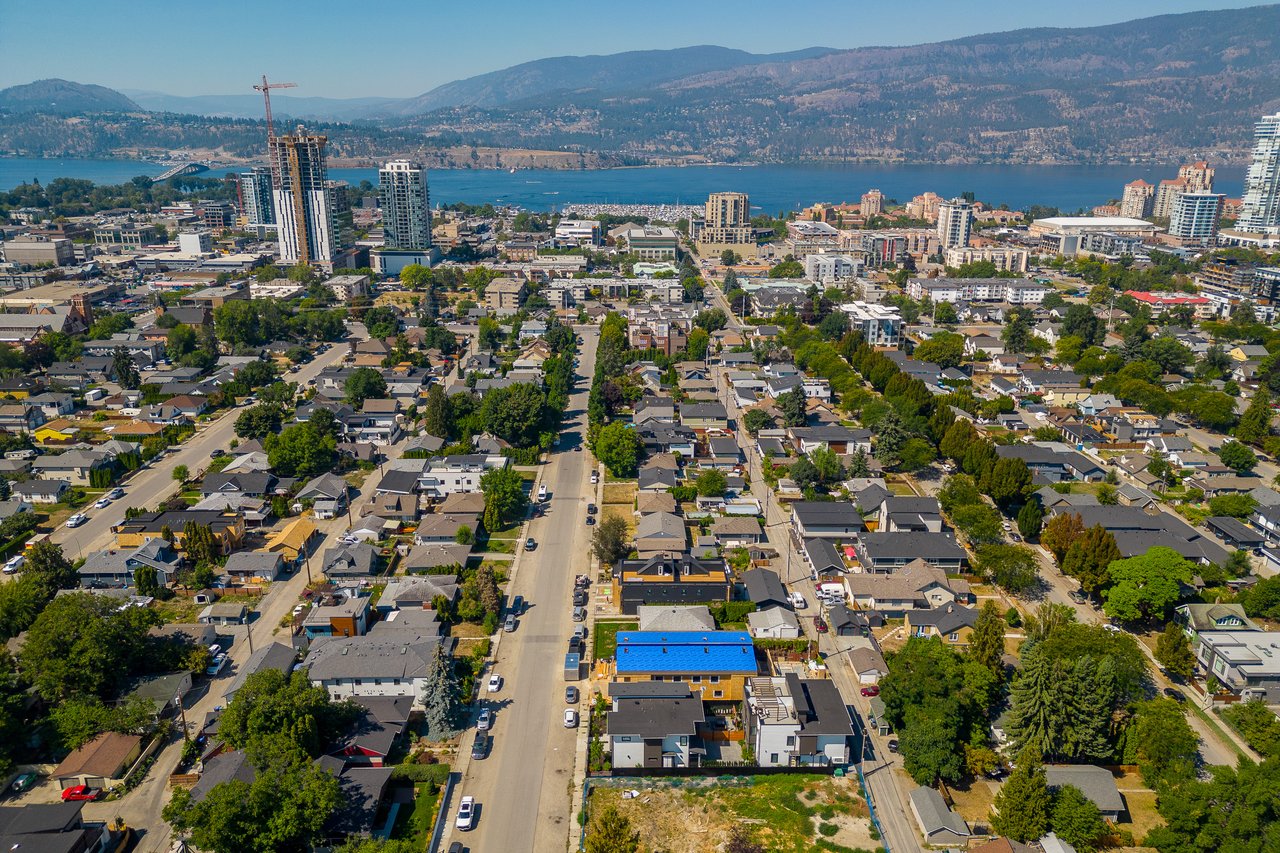
Explore the Q3 2026 market by property type
- Central Okanagan Real Estate Market Update: What Really Happened in Q3 2026
- Kelowna Detached Home Market Q3 2026: Why Benchmark Prices Rose While Sales Slowed
- Kelowna Townhome Market Q3 2026: Why Prices Fell and What Downsizers Should Know
- Kelowna Condo Market Q3 2026: Prices Rose, Sales Slowed and Supply Is Coming
Sources and methodology
Source and methodology: Association of Interior REALTORS®, Q3 2026 Okanagan Market Overview (October 2026), pp. 1–7. Q3 sales and days-to-sell figures cover the quarter; benchmark prices and inventory reflect September 2026. Changes are compared with the same period a year earlier. Central Okanagan is a regional MLS geography, not Kelowna city alone. Detached benchmark statistics exclude lakefront and acreage homes. Benchmark prices are not average transaction prices or estimates of any particular property. The underlying member report was supplied directly for this analysis; figures are paraphrased, not reproduced as AIR graphics. Association: https://www.interiorrealtors.ca/market-statistics/ .
Author: Mark Coons, Selling Okanagan Group | eXp Realty | 778-946-6454. Reviewed: October 30, 2026.